
9.7 Example: lightPlotter and lightPlotterScaled
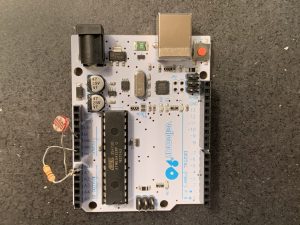
The Arduino IDE provides a serial plotter that can be used to plot data. In this example, an analog input voltage is created using a voltage divider circuit shown below. One end of a CDS cell is connected to the 5V output pin; the other end is wrapped around a 10kΩ resistor and connected to analog input pin A0; the other end of the resistor is connected to an Arduino Uno ground pin.
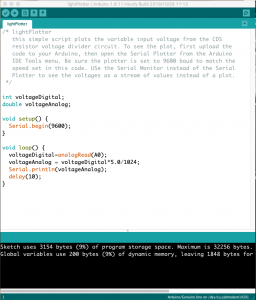
A simple script that reads the analog value on pin A0, converts it to a voltage between 0 and 5V, and sends the result to the serial port is shown.
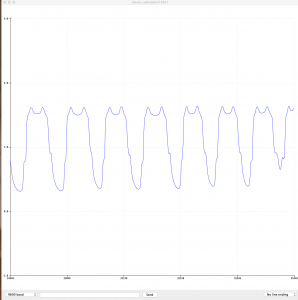
A screen shot of the serial plotter display captured as a flashlight beam moved back and over the CDS cell is shown below. The Arduino Uno automatically scales the Y-axis of this display.
Here is the text for this code:
/* lightPlotter
this simple script plots the variable input voltage from the CDS
resistor voltage divider circuit. To see the plot, first upload the
code to your Arduino, then open the Serial Plotter from the Arduino
IDE Tools menu. Be sure the plotter is set to 9600 baud to match the
speed set in this code. USe the Serial Monitor instead of the Serial
Plotter to see the voltages as a stream of values instead of a plot.
*/

int voltageDigital;
double voltageAnalog;

void setup() {
   Serial.begin(9600);
}

void loop() {
   voltageDigital=analogRead(A0);
   voltageAnalog = voltageDigital*5.0/1024;
   Serial.println(voltageAnalog);
   delay(10);
}
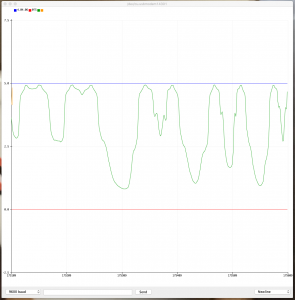
A variation of this script, shown below, uses four additional Serial.print statements to draw 0 and 5V lines on the plot and prevent the Y-axis from autoscaling.
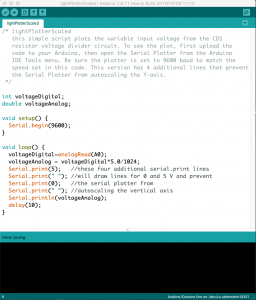
A screen shot of the serial plotter output is shown below. This was captured as a flashlight beam was move back and forth over the CDS cell, resulting in an oscillating value for the input voltage.
The code listing follows:
/* lightPlotterScaled
this simple script plots the variable input voltage from the CDS
resistor voltage divider circuit. To see the plot, first upload the
code to your Arduino, then open the Serial Plotter from the Arduino
IDE Tools menu. Be sure the plotter is set to 9600 baud to match the
speed set in this code. This version has 3 extra lines to prevent
the Serial Plotter from autoscaling the Y-axis.
*/

int voltageDigital;
double voltageAnalog;

void setup() {
Serial.begin(9600);
}

void loop() {
   voltageDigital=analogRead(A0);
   voltageAnalog = voltageDigital*5.0/1024;
   Serial.print(5); //these four additional serial.print lines
   Serial.print(" "); //will draw lines for 0 and 5 V and prevent
   Serial.print(0); //the serial plotter from
   Serial.print(" "); //autoscaling the vertical axis
   Serial.println(voltageAnalog);
   delay(10);
}
