4.2 Diode I-V Characteristic Curves and Load Lines
The following graph shows part of the  curve for the red LED in the ECE361 electronics kit. This curve was obtained from the data sheet for this LED, and the URL for that data sheet can be found in section 1.4 of this book. The curve reveals that a forward current (that is, current flowing from anode to cathode) of ~0 to ~ 45mA would flow through the diode when an external voltage of ~ 1.5V to ~ 2.0V is applied across the diode between anode and cathode. The “knee” or turn-on voltage, above which significant current begins to flow, is ~
 or
or  ; an applied voltage less than this value results in negligible current flow, whereas an applied voltage
  results in increasing current flow through the device. Note how the current increases rapidly from `
 mA to
mA to  mA as the applied voltage increases from
  to just under
  volts. The data sheet for this device specifies that the maximum safe current through the red LED is
  . Above this value, the LED would be damaged due to internal heating.
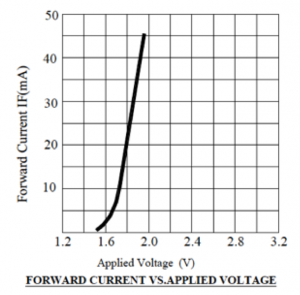
Figure 4.12, also part of the data sheet for the red LED, characterizes the luminous intensity, which is a measure of the radiated light brightness, versus forward current. The luminous intensity varies between  and
and  mcd (millicandela) as the forward current varies between and
  mA. For comparison, cd (candela) is the luminous intensity of a common candle, so the LED with mcd =
  cd is
cd is  as bright as a common candle at a forward current of mA. (The LEDs in the ECE361 kits are typical low-brightness lights used to indicate that a device is on or off; other LEDs are designed with significantly higher brightness values. For example, the Cree PLCC6 LED, used in outdoor transportation and roadway signs, has a luminous intensity as high as
  mcd.)
mcd.)
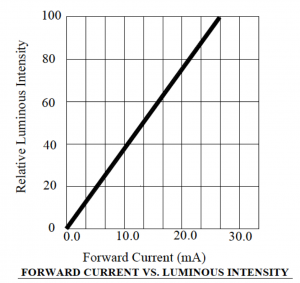
The curve shown in figure 4.12 indicates that the radiated light intensity is approximately doubled as the forward current increases from  mA (luminous intensity of ~
 mcd) to
  mA (luminous intensity of ~
 mcd). [Note that these luminous intensity values are only approximate as we are reading them from the plot of figure 4.12]. If we had access to a variable DC voltage supply that could be connected in parallel with the red LED, we could chose the desired relative intensity we wanted to achieve from the LED and use these two curves to determine the appropriate voltage to apply across the diode to generate a desired current and, hence, a desired brightness.
Examples
Example: What applied LED voltage would be needed to achieve a luminous intensity of  mcd for the red LED described by figures 4.11 and 4.12?
Solution: The luminous intensity vs. forward current curve shown in figure 4.12 indicates that a luminous intensity of ~ mcd corresponds to a forward current of ~ mA. The forward current vs. applied voltage curve of shown in figure 4.11 indicates that a forward current of mA corresponds to an applied voltage of  V. Thus, setting the voltage across the red LED to V would cause a forward current of mA to flow, and the diode will emit red light at an intensity of ~ mcd.
Here is a video showing the LED current and brightness increasing as the applied voltage across a diode increases. Warning: four LED’s were harmed during the making of this video.
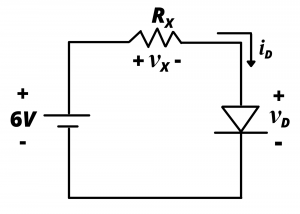
Consider a circuit comprised of a  battery connected in parallel with the red LED having the curve just discussed. What would be the value of the diode current,
  , and how would the LED behave in the circuit of Figure 4.13?
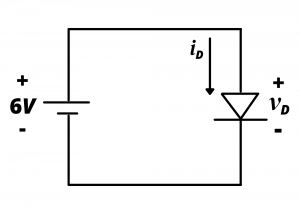
Clearly,  V. The curve for the red LED plotted in figure 4.11 extends to a maximum voltage of ~
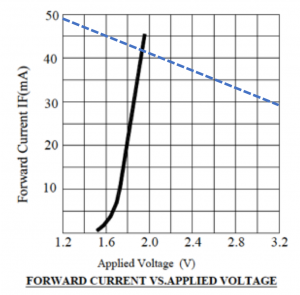
 V and corresponding current of mA. Extrapolation is needed to determine the current corresponding to volts. Figure 4.14 shows that the diode curve has a slope of
  in the forward bias region. Assuming this slope was valid for bias voltages as high as
  V, increasing the voltage from
  to would result in a current of
  . This clearly is substantially above the maximum forward current for the LED and the LED would burn out immediately after the is applied. See figure 4.15. The correct way to illuminate the LED would be to design a circuit that operates the LED at a safe current level, such as that indicated by the lower red dot in the Fig. 4.14, corresponding to an applied LED voltage of
  and a forward current of
  . This is discussed below.
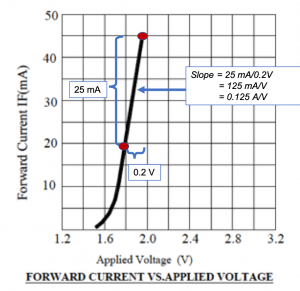
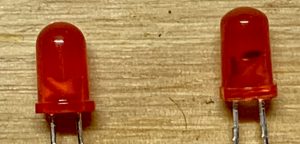
Figure 4.15 is a photograph comparing two red LEDs. The LED on the left is functional while the LED on the right was attached directly to a 6V battery; it was immediately damaged and rendered inoperable due to the high current.
Use of a current-limiting resistor. The circuit in figure 4.16 uses a resistor to limit the current flowing in the diode, and the resistance can be chosen to operate the LED at the desired  ,
,  operating point on the diode’s curve discussed above.

To determine the appropriate value of resistance  , we apply KVL around the loop:
(1) 
or
(2) 
from which we obtain
(3) 
substituting our desired operating point values  and
and  into eq. (3), we find that
(4) 
Selecting a  resistor would this cause the red LED to be operated at the point on its curve corresponding to a voltage drop of and a forward current of .
Load line analysis to determine diode operating point. Now consider the case where we have the LED circuit containing the current-limiting resistor shown above, but with  . What would be the voltage drop, forward current, and luminous intensity of the red LED in this case? We can determine the values for voltage drop and forward current by plotting a load-line on the curve for the diode. This is done by first writing KVL around the circuit loop of figure 4.16 with
  and
and  and kept as unknowns:
(5) 
Equation (5) represents the set of possible pairs of values for and that would satisfy KVL for the circuit shown in figure 4.16. Since the circuit contains a diode, the set of possible values of and is further constrained to be those values that simultaneously satisfy eq. (5) and the curve for the red LED. Figure 4.17 shows eq. (5) superimposed on the curve, and the intersection between the two curves is the point  . (The values are approximate because we are reading them from the graph). The luminous intensity would exceed
  at this current according to the intensity vs current plot of figure 4.12. If the red LED were operated at this point, its lifetime would be shortened as this current value exceeds the specified maximum recommended current of specified in the manufacturer’s data sheet.
Examples
Determine the luminous intensity for a red LED in the circuit shown in figure 4.18 when  . Repeat for
  .
.
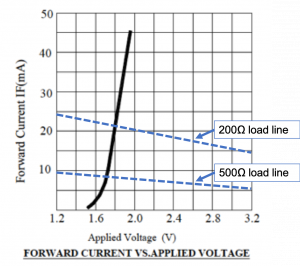
Solution: To solve this problem, we first plot the load line for a  resistor on the
  curve for the red LED to determine the diode operating point (, ). Once is known, the luminous intensity can be obtained from the intensity vs. forward current curve for the LED. Proceeding as in the example above, KVL gives us:
(6) 
To superimpose the load line on the curve plot, we note the curve plots forward current in mA vs. diode voltage. Since in the KVL equation has units of  , rather than
  , we re-write that equation as
(7) 
or
(8) 
Writing (in mA) versus , we have
(9) 
To plot this line on the curve, we note that when  mA, and when
  mA. The
  load line is shown as a dashed line drawn between points
  and
and  . The intersection between the load line and the curve for the diode is at (
 ) indicating the voltage drop across the LED will be and the forward current will be
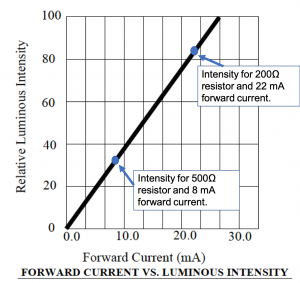
  when a resistor is used in the circuit. A forward current of corresponds to an intensity of
  as indicated by the intensity vs. forward current curve, below.
For the case of the  resistor, we proceed as we did for the resistor, with the KVL equation giving
(10) 
The load line is plotted as a dashed line between the points ( ) and
) and  , giving the red LED operating point as
  and
and  . This forward current corresponds to an intensity of
  as indicated below.