
Determining how many lengths and setting up your raw data table
Setting up the raw data table
So now you have determined:
- How many trials.
- How many oscillations for each trial.
The last thing to determine is how many different pendulum lengths you are going to do. Along the way, we will build our big raw data table. Let’s add a third sheet to our workbook:
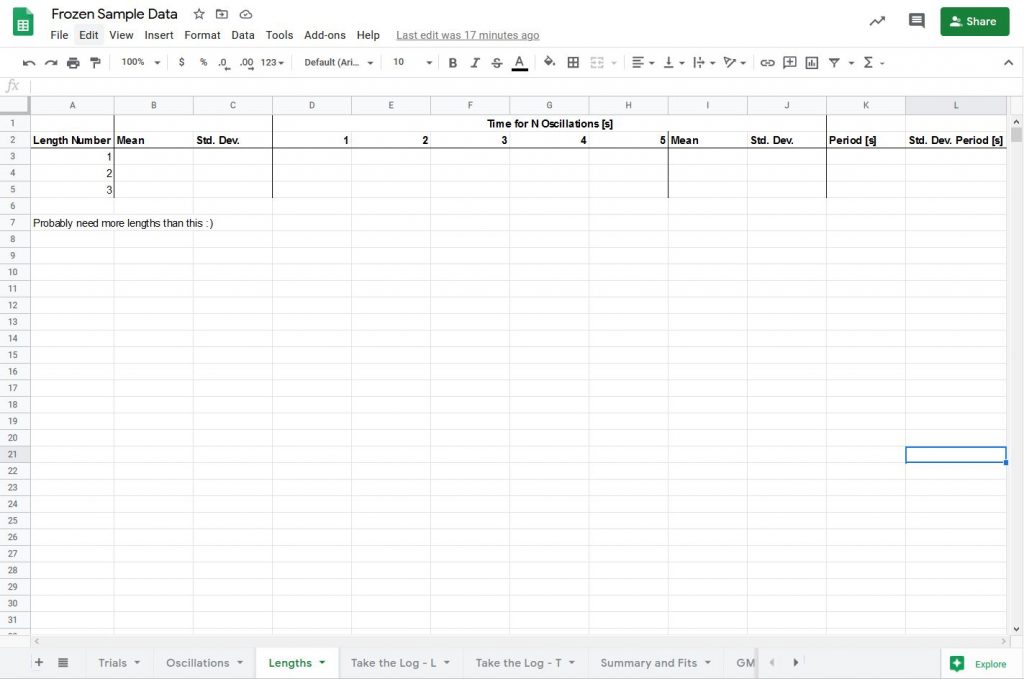
The first column is where you will list your lengths. For each pendulum length you will need to measure it in such a way as to get an uncertainty (columns B and C). Then you have your trials (5 in the above example, but you will determine how many) with each trial being the number of oscillations you decided to use. These trials get a mean and standard deviation of the total time which can then be converted to a period and its uncertainty using the number of oscillations.
How many lengths to do? Plot as you go!
As you go, make a plot. Using the columns in the example sheet above, I would plot B on the horizontal and K on the vertical with C and L as my uncertainties. Keep adding lengths until you begin to see a clear pattern. When you think a pattern is clear, stop.
