
Introduction to Statistical vs. Systematic Uncertainty
The following is based upon, with permission:
Denker, J. Uncertainty as Applied to Measurements and Calculations. Uncertainty as Applied to Measurments and Calculations (2011). Available at: http://www.av8n.com/physics/uncertainty.htm. (Accessed: 26th August 2016).
A thought experiment and discrete vs. continuous variables
- 3.14201 s
- 3.1415926897940001 s
Statistical uncertainty
- With each drop, I measure a different time. For example, let’s say I get the four observations in the table below. The variation in these observations is the uncertainty. We will learn how to quantify this uncertainty in a later section. But for now, the important point is that the variation in these numbers is the uncertainty.
Observation Measured Times [s] 1 3.142 2 3.140 3 3.145 4 3.143 - I get the same value, 3.142 s, each time. This might be because the device i’m using has a limited precision. In our example, our stopwatch only goes to the millisecond. Therefore, even if we got 3.142 each and every time we might not believe that last digit and assign an uncertainty of a millisecond, ±0.001s.
In summary, we can either measure it from the variations or, if we cannot measure it because our device’s limited precision, we can assign an uncertainty. Both of these possibilities are examples of : they are due to the intrinsic randomness of continuous variables and the unknowability of the true value.
Systematic uncertainty
| Observation | My watch [s] | Your watch [s] | Atomic clock + laser setup [s] |
| 1 | 3.142 | 5.312 | 5.370001 |
| 2 | 3.140 | 5.002 | 5.370003 |
| 3 | 3.145 | 5.687 | 5.370002 |
| 4 | 3.143 | 5.479 | 5.370001 |
Summary
- All continuous variables have statistical uncertainty.
- Intrinsic randomness of the Universe.
- Sometimes you can measure it with the variation.
- Sometimes you need to assign it based upon the precision of your device.
- In addition, measurement devices can have systematic uncertainties.
- These are generally harder to get a handle on.
- One way is to try and measure a different way.
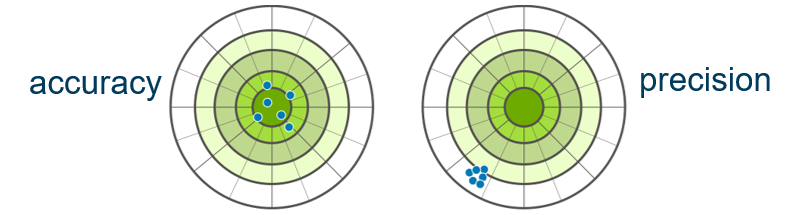
- Statistical and systematic uncertainties are related to the ideas of accuracy and precision.
- We will explore quantifying these uncertainties in a later section.
The indicated measurement is the observational result of a continuous variable as reported by your measuring device, which has a limited precision.
The unknowable actual value of a continuous variable including the infinite number of decimal places.
A quantity, like time or mass, whose values are continuous: they can take on any value with an infinite number of decimal places.
Variables, such as dice rolls or counting atoms, that can only take on specific values. You cannot have half an atom!
Uncertainty arising from any measurement of a continuous variable. The true value is not only unknown, but unknowable due to its infinite number of digits. Moreover, there is intrinsic randomness from measurement to measurement.
A consistent difference between the indicated and true values, usually arising from a miscalibrated instrument or neglected effect. A systematic uncertainty is always in the same direction as opposed to the random bouncing around characteristic of statistical uncertainties.
