
19 Motivating Context for Unit III
This unit will focus on the electric field  and the electric potential
  . As described in the introduction, the electric force is the underpinning of chemistry, so I would like you to refresh some ideas about chemical bonds that you probably saw in your chemistry classes that we will use in this unit.
Another case that we will explore in some detail in this unit is gel electrophoresis: a process you have probably discussed in your biology class. This laboratory technique is fundamentally based upon the ideas of electric field and potential we will discuss in this unit. Thus, a review of the procedure based upon OpenStax Microbiology chapter 12.2 is included below for your review.
Molecular Bond Basics
describes a covalent bond as the overlap of half-filled atomic orbitals (each containing a single electron) that yield a pair of electrons shared between the two bonded atoms. We say that orbitals on two different atoms overlap when a portion of one orbital and a portion of a second orbital occupy the same region of space. According to valence bond theory, a covalent bond results when two conditions are met: (1) an orbital on one atom overlaps an orbital on a second atom, and (2) the single electrons in each orbital combine to form an electron pair. The mutual attraction between this negatively charged electron pair and the two atoms’ positively charged nuclei serves to physically link the two atoms through a force we define as a covalent bond. The strength of a covalent bond depends on the extent of overlap of the orbitals involved. Orbitals that overlap extensively form bonds that are stronger than those that have less overlap. We calculated the shapes of these orbitals for simple molecules such as 1,3-butadine in class during Unit I by modeling the electrons as a particle in a box!
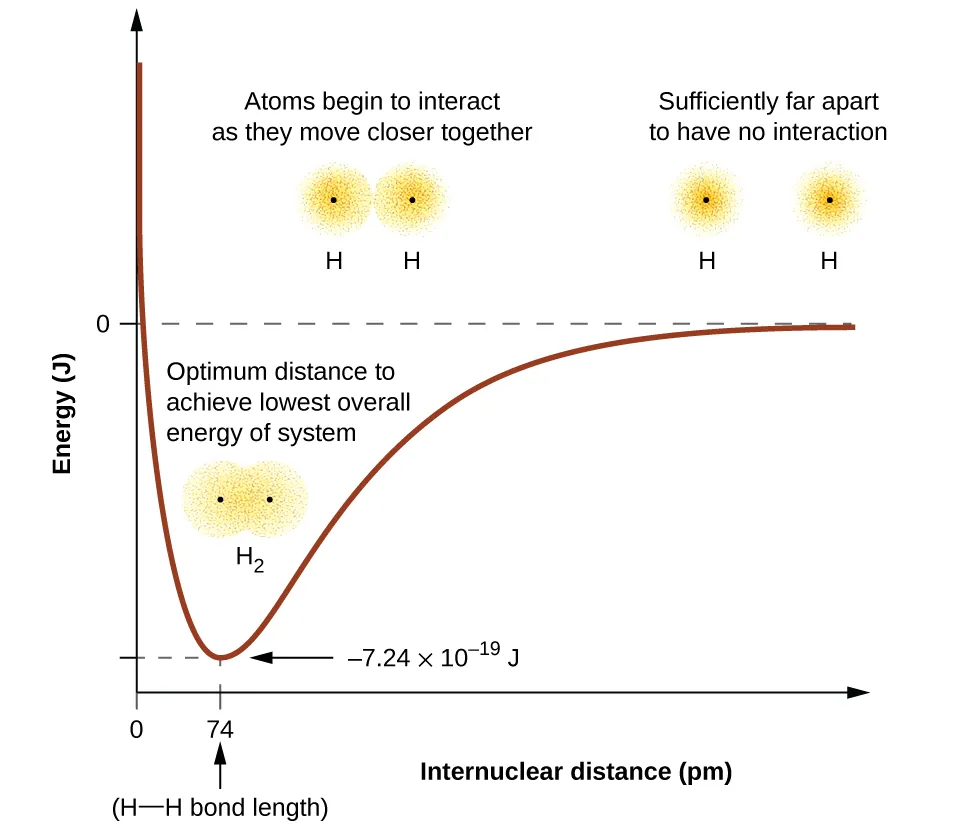
The energy of the system depends on how much the orbitals overlap. Figure 1 illustrates how the sum of the energies of two hydrogen atoms (the colored curve) changes as they approach each other. When the atoms are far apart, there is no overlap, and by the convention described in Unit I – Chapter 5 Some Energy-Related Ideas that Might be New or Are Particularly Important: The Potential Energy of Atoms and Molecules, the potential energy of each atom is zero. As the atoms move together, the electron waves (orbitals) begin to overlap. Each electron begins to feel the attraction of the nucleus in the other atom. In addition, the electrons begin to repel each other, as do the nuclei. The result is that the electron waves change shape in response.
Although the atoms are still widely separated, the attraction is slightly stronger than the repulsion, and the energy of the system decreases. (A bond begins to form.) As the atoms move closer together, the overlap increases, so the attraction of the nuclei for the electrons continues to increase (as do the repulsions among electrons and between the nuclei). At some specific distance between the atoms, which varies depending on the atoms involved, the energy reaches its lowest (most stable) value. This optimum distance between the two bonded nuclei is the bond distance between the two atoms. The bond is stable because at this point, the attractive and repulsive forces combine to create the lowest possible energy configuration. If the distance between the nuclei were to decrease further, the repulsions between nuclei and the repulsions as electrons are confined in closer proximity to each other would become stronger than the attractive forces. The energy of the system would then rise (making the system destabilized), as shown at the far left of Figure 1.
Play with the energies of atoms and bonds
Below is a simulation where you can see the energies of atoms and their bonds. Play around with it. In this simulation, one atom is “pinned down” and the other is free to move.
- Drag the free atom wherever you wish and let it go. It will move according to its potential energy.
- You can see the overlap in the electron waves (electron clouds) at the bottom.
- You can change the types of atoms using the menu in the upper right.
- You can turn on the forces as well to see how the forces are responding to the potential energy.
You will notice that the atoms do not stay at a fixed distance; they bounce as skateboarders on a hill! You can even get neon atoms to “bond,” although there is not a lot of room to do so! This is true; at small enough temperatures, you can get neon to bond. At 24.56 K, it will actually become a solid. You can see O=O, on the other hand, has a much deeper well and is, therefore, a much stronger bond.
Basic Description of Gel Electrophoresis
There are a number of situations in which a researcher might want to physically separate a collection of DNA fragments of different sizes. A researcher may also digest a DNA sample with a restriction enzyme to form fragments. The resulting size and fragment distribution pattern can often yield useful information about the sequence of DNA bases that can be used, much like a bar-code scan, to identify the individual or species to which the DNA belongs.
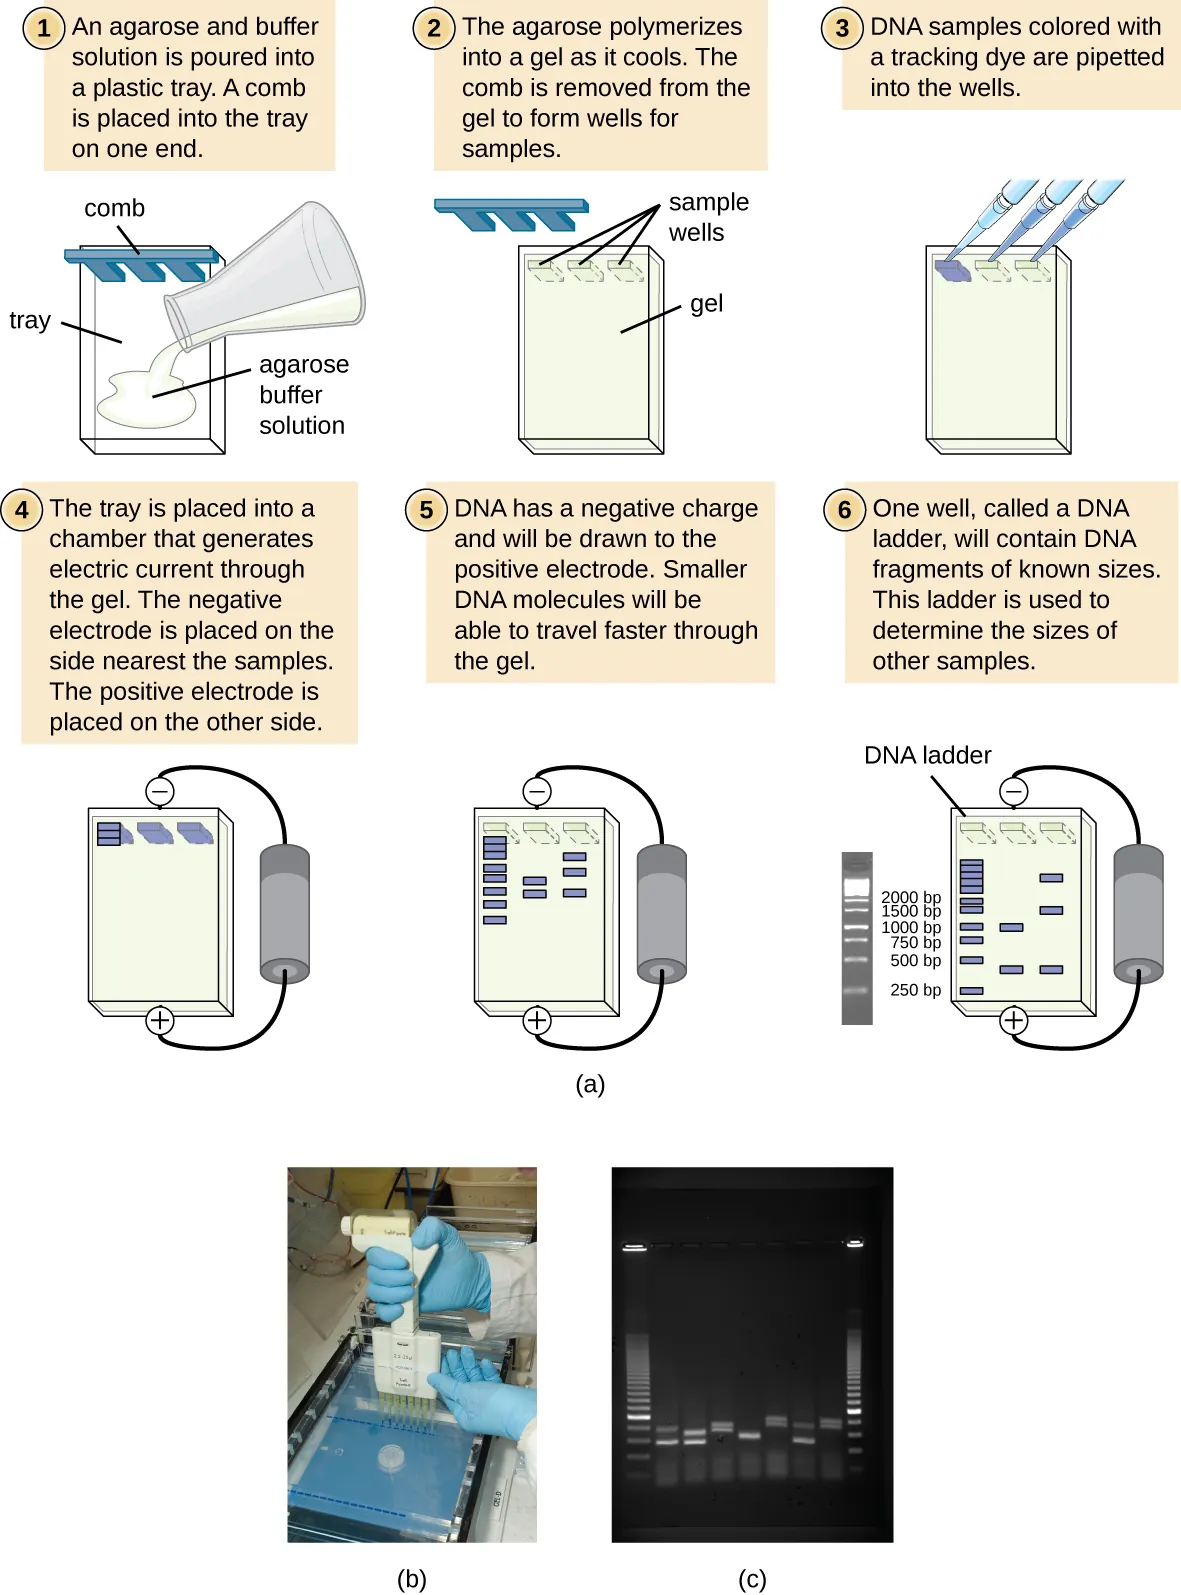
Gel electrophoresis is a technique commonly used to separate biological molecules based on size and biochemical characteristics, such as charge and polarity. Agarose gel electrophoresis is widely used to separate DNA (or RNA) of varying sizes that may be generated by restriction enzyme digestion or by other means, such as the PCR (Figure 2).
Due to its negatively charged backbone, DNA is strongly attracted to a positive electrode. In agarose gel electrophoresis, the gel is oriented horizontally in a buffer solution. Samples are loaded into sample wells on the side of the gel closest to the negative electrode, then drawn through the molecular sieve of the agarose matrix toward the positive electrode. The agarose matrix impedes the movement of larger molecules through the gel, whereas smaller molecules pass through more readily. Thus, the distance of migration is inversely correlated to the size of the DNA fragment, with smaller fragments traveling a longer distance through the gel. Sizes of DNA fragments within a sample can be estimated by comparison to fragments of known size in a DNA ladder, also run on the same gel. To separate very large DNA fragments, such as chromosomes or viral genomes, agarose gel electrophoresis can be modified by periodically alternating the orientation of the electric field during pulsed-field gel electrophoresis (PFGE). In PFGE, smaller fragments can reorient themselves and migrate slightly faster than larger fragments, and this technique can thus serve to separate very large fragments that would otherwise travel together during standard agarose gel electrophoresis. In any of these electrophoresis techniques, the locations of the DNA or RNA fragments in the gel can be detected by various methods. One common method is adding ethidium bromide, a stain that inserts into the nucleic acids at non-specific locations and can be visualized when exposed to ultraviolet light. Other stains that are safer than ethidium bromide, a potential carcinogen, are now available.
Describes a covalent bond as the overlap of half-filled atomic orbitals (each containing a single electron) that yield a pair of electrons shared between the two bonded atoms.
