43 Springs
OpenStax
Summary
- State Hooke’s law.
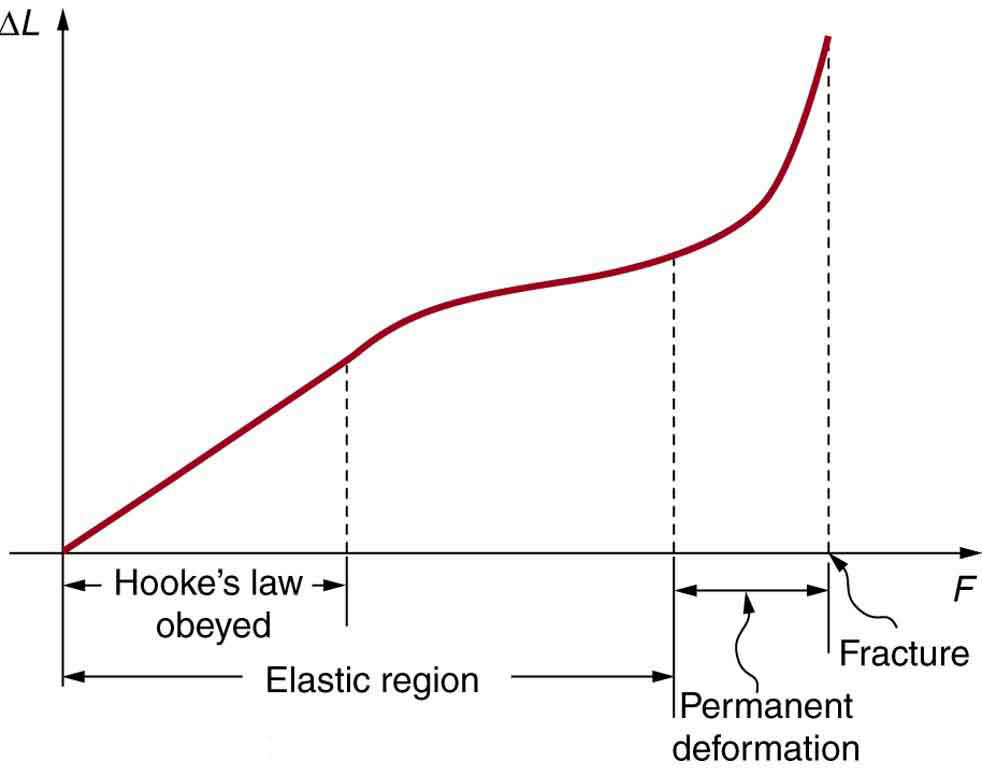
- Explain Hooke’s law using graphical representation between deformation and applied force.
We now move from consideration of forces that affect the motion of an object (such as friction and drag) to those that affect an object’s shape. If a bulldozer pushes a car into a wall, the car will not move but it will noticeably change shape. A change in shape due to the application of a force is a deformation. Even very small forces are known to cause some deformation. For small deformations, two important characteristics are observed. First, the object returns to its original shape when the force is removed—that is, the deformation is elastic for small deformations. Second, the size of the deformation is proportional to the force—that is, for small deformations, Hooke’s law is obeyed.
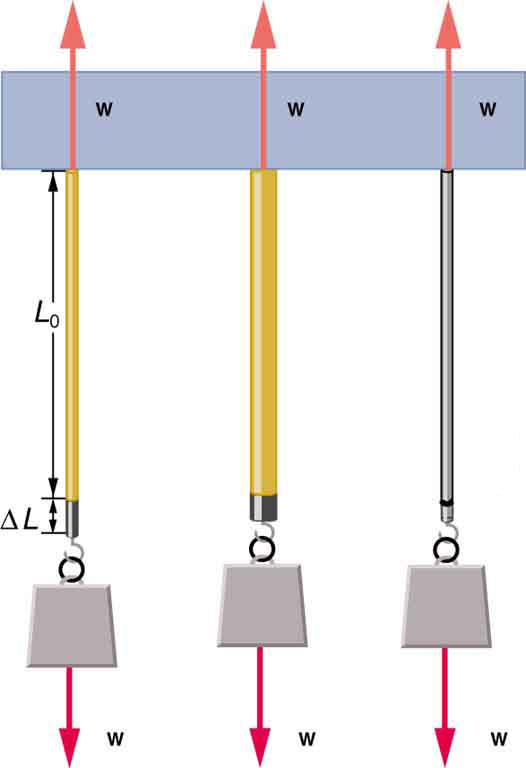
The proportionality constant depends upon a number of factors for the material. For example, a guitar string made of nylon stretches when it is tightened, and the elongation
 is proportional to the force applied (at least for small deformations). Thicker nylon strings and ones made of steel stretch less for the same applied force, implying they have a larger(see the figure below). Finally, all three strings return to their normal lengths when the force is removed, provided the deformation is small. Most materials will behave in this manner if the deformation is less than about 0.1% or about 1 part in