
44 Dataset 1: How Physics Impacts Evolution – Barracuda vs. Brine Shrimp
Brokk Toggerson
Why do different animals look different?
This is the fundamental question for this dataset. While many different factors shape the evolution of animal body plans, from feeding strategies to predation concerns, locomotion plays a key role. For example, the fact that many bird species fly impacts other aspects of their body plan such as their hollow bones which reduce weight. Such a factor is particularly relevant in the case of animals that swim as water provides much more resistance to motion than air.
Investigating this effect by comparing two animals: barracudas and brine shrimp
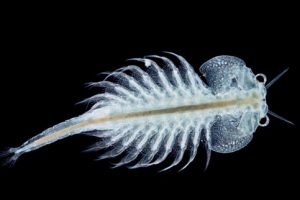
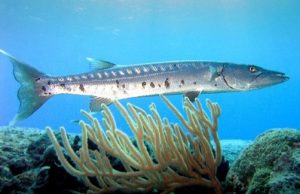
Both the great barracuda (Sphyraena barracuda) and the brine shrimp (Artemia salina) live in the ocean and yet look very different as visible in the table below. The barracuda is slim and streamlined while the brine shrimp is… not. Why? To explore this, you will be looking at the “coasting distance” for each of these animals. We will define the coasting distance to be: assume the animal is swimming at its maximum speed when it stops actively propelling itself, how far will it coast? Now, since the brine shrimp is both smaller and swims more slowly, we might expect it to coast less of a distance. An analogy is thus: Dr. Toggerson’s 45 lbs four year old can easily lift two full gallons of milk (about 16 lbs). Meanwhile, the 170 lbs Dr. Toggerson can lift his daughter with a similar level of ease. Which is more impressive? How did you determine this?
| Pictures and basic data comparing the brine shrimp and the great barracuda. | Brine Shrimp (Artemia salina)
|
Great Barracuda (Sphyraena barracuda)
|
| Mass | 7.5×10⁻⁵ kg | 5.75 kg |
| Distance from Middle to Edge Across |
4 mm | 10 cm |
| Length | 10 mm | 80 cm |
| Maximum Swim Speed | 3 mm/s | 12 m/s |
Key Questions
- If you want to fairly compare the brine shrimp and the barracuda’s coasting distance, what might be the best approach? (Hint: think about comparing the lifting ability of Dr. Toggerson and his daughter described above).
What you need to figure out
Kinematics
In this simulation, you have the speed of these two creatures as a function of time. Each creature is on a separate sheet. As usual, you will need to make a copy so that everyone is not editing the same one!
Key Questions
- What fraction of its speed does each creature lose in its first 0.01s of travel?
- How long before the creature has lost 80% of its initial speed?
- How far does it travel in that time? (Hint: think about the question above on how to compare these two species fairly!).
Forces
Key Questions
- What forces act and in what directions?
- What is the Reynolds Number at the beginning and at the time where the creature has lost 80% of its initial speed?
- Under what conditions would you expect a creature to be streamlined?
Energy
Key Questions
- What are the value(s) for the relevant energy(ies) at the initial moment and the point at which it has lost 80% of its initial speed?
- Tell me a story about how the energy flows.
Additional data you may need
Drag Coefficients
Properties of Sea Water[1]
| Parameter | Value |
Viscosity  of sea-water of sea-water |
 |
Density  of sea-water of sea-water |
 |
- The engineering toolbox: https://www.engineeringtoolbox.com/sea-water-properties-d_840.html taken at the ocean average of 4oC. ↵
