
6 Lab Activity 6
Resonance of an Air Column
Background
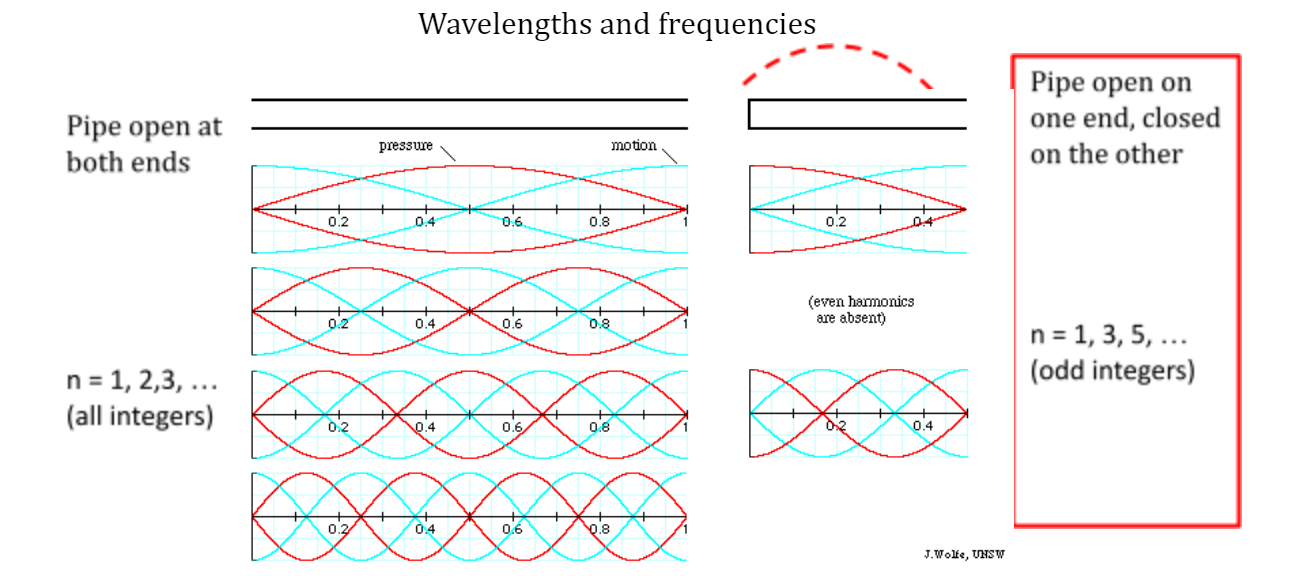
Recall that a standing wave pattern is generated when waves traveling in the forward and reverse direction add, or superpose, to give a pattern of regions with nodes and antinodes. This is because a sound wave reflecting off an open end is inverted, causing a cancellation in pressure amplitudes between the waves arriving and reflecting back from the open end, ensuring that the pressure at the end is equal to atmospheric pressure at ALL instants in time. This means that the standing wave has a node at an open end. At the closed end, the sound wave undergoes a reflection that leaves it unaltered, meaning it can have ANY amplitude at that end, implying the sound wave has an antinode at the closed end.
The wavelengths of sound at which a resonance is heard in an air column that is open at one end and closed at the other are indicated below in the formulas and the figure on the right hand side. (On the left is the scenario of tubes open at both ends, which is analogous to the case of a string fixed at both ends. We are not using this in today’s lab).
In Person Lab
Experiment 1: Vertical Resonance Tube
In Person Experiment 1
Experiment 1 Equipment: Vertical resonance tube, water, tuning forks, meter stick
- Pour water into the metal reservoir and fill the glass tube such that the level of the water in the tube rises when the metal reservoir is raised. Play with changing the level of the water in the tube by raising and lowering the metal container.
- Choose a tuning fork, note the frequency in your report
- Assuming the ambient temperature is 20 °C, the speed of sound in air is expected to be 344 m/s. Calculate the corresponding expected wavelength of the sound wave generated by the tuning fork in air.
- Now strike the tuning fork, and hold it over the tube. Raise and lower the level of water till the tuning fork sound is amplified – this means you have reached resonance. Write down the length L of the air column when this happens. This is the distance between the top of the tube and the level of the water.
- Calculate: 4L/λ, where λ is the wavelength you found in step 3 and L the length of the air column from step 4. What integer is this number closest to?
- Below are the formulas for the wavelengths and frequencies of the resonant standing waves modes of an air column for a tube open at one end and closed at the other (see instructor’s slides)
- λn = 4L/n
- fn = nv/4L
- Using the formulas in step 6 and the integer ratio you calculated in step 5, identify which resonant harmonic this is of the column of length L.
- Find another height L at which you get an increase in sound amplitude for the same tuning fork. Record the air column length L. Calculate the same ratio as in step 5. Which resonant mode of the new air column have you found?
- Find a new tuning fork with a different frequency. Use the frequency to predict at what air column length you should find a resonance.
- Record:
- New frequency
- Corresponding expected wavelength of sound in air
- Prediction of required length of air column for mode 1
- Predict required length of air column for a higher harmonic
- Record n for this higher harmonic
- Predict L
- Try it!
- Did it work? Answer in your report
- Finally, you will use this experiment to measure the speed of sound. Use one of your measurements of L and the calculated wavelength λ of the mode using the formula in step 6. Multiply this by the frequency f of the tuning fork used in that measurement.
- Record n
- Calculate: λn = 4L/n
- Calculate: v = λf
In Person Experiment 1 Exercise
How close is this value to the expected speed of sound? What could be sources of error in these measurements?
Experiment 2: Horizontal Resonance Tube
In Person Experiment 2
Experiment 2 Equipment: Horizontal air column tube, tuning forks, meter stick
- Choose a tuning fork, note the frequency in your report
- Assuming the ambient temperature is 20 °C, the speed of sound in air is expected to be 344 m/s. Calculate the corresponding expected wavelength of the sound wave generated by the tuning fork in air.
- Now strike the tuning fork, and hold it at the opening of the tube. Move the piston back till the tuning fork sound is amplified – this means you have reached resonance. Write down the length L of the air column when this happens. This is the distance between the end of the tube and the piston.
- Calculate: 4L/λ, where λ is the wavelength you found in step 3 and L the length of the air column from step 4. What integer is this number closest to?
- Below are the formulas for the wavelengths and frequencies of the resonant standing waves modes of an air column for a tube open at one end and closed at the other (see instructor’s slides)
- λn = 4L/n
- fn = nv/4L
- Using the formulas in step 5 and the integer ratio you calculated in step 4, identify which resonant harmonic this is of the column of length L. Which resonant mode of the air column have you found?
- Find another height L at which you get an increase in sound amplitude for the same tuning fork. Record the air column length, calculate the same ratio as in step 4. Which resonant mode of the new air column have you found?
- Find a new tuning fork with a different frequency. Use the frequency to predict at what air column length you should find a resonance.
- Record:
- New frequency
- Corresponding expected wavelength of sound in air
- Prediction of required length of air column for mode 1
- Predict required length of air column for a higher harmonic
- Record n for this higher harmonic
- Predict L
- Try it!
- Did it work? Answer in your report
- Finally, you will use this experiment to measure the speed of sound. Use one of your measurements of L and the calculated wavelength λ of the mode using the formula in step 5. Multiply this by the frequency f of the tuning fork used in that measurement.
- Record n
- Calculate: λn = 4L/n
- Calculate: v = λf
In Person Experiment 2 Exercise
How close is this value to the expected speed of sound? What could be sources of error in these measurements?
Remote Lab
Part 1: Resonance of Horizontal Air Column
Remote Experiment 1
Equipment: Video of Horizontal air column tube, tuning forks, meter stick: https://youtu.be/EJ8_HYO242U
In the video linked above, I do an experiment to find the resonances of a horizontal tube open at one end and closed at the other by a movable piston. A tuning fork is struck at the open end, and the piston moved till a loud tone is heard, indicating the presence of a resonance. The length of the air column is the region between the open end of the tube, and the head of the piston.
- For each heard resonance, note the frequency of the tuning fork used, and the length at which the resonance was heard, in columns 2 and 3 of Table 1 in your report
- Headers for Table 1 are shown below.
- Assuming the ambient temperature is 20 °C, the speed of sound in air is expected to be 344 m/s. Calculate the expected wavelength of the sound wave generated by the tuning fork in air using v = λf. Enter this in column 4 of Table 1.
- For each successive longer length at which a resonance is heard for a given tuning fork, the frequency of the tuning fork represents a higher harmonic (since the fundamental frequency for a longer tube is lower). To find that harmonic number, we use the equation for the resonant wavelengths and solve it for the harmonic or mode number n.
- Use the λ values from column 4 combined with the length L from column 3 to find the mode number n for each row: λn=4L/n implies n= 4L/λ. When you calculate this, it will likely be a decimal. Find the closest integer to this value, and enter it in column 5 of Table 1.
- You will now use this harmonic number along with the tuning fork frequency and the measured column length to calculate the actual speed of sound. Use the frequency from column 2 and the length from column 3 to calculate the speed v = λf = (4L/n)f . Enter this value in column 6 of Table 1.
- Find and record the average values in column 6. This is your experimental result for the speed of sound.
Table 1 Headers:
| Run # | Tuning Fork frequency (Hz) | Length (m) | λ (m) | Mode # n | Sound Speed
(m/s) |
| 1 |
Remote Lab 1 Exercise
How does you value found in step 6 for the speed of sound compare to the expected result? Discuss.
Part 11: Resonance in a Bottle
Remote Experiment 2
Equipment needed: empty bottle (glass preferred); water, measuring cup, ruler, Phyphox app on your smartphone.
In this part of the lab, you will be using the resonant frequencies of the air in a bottle – also known as a Helmholtz resonator, to determine the speed of sound. Many musical instruments, such as an ocarina, and certain kinds of whistles, are Helmholtz resonators, which consist of a body containing a volume of air, topped by an opening with a neck. A bottle is a good example of one. When you blow across the top of the bottle, the air inside vibrates in response to the increased pressure, and can set up a resonance. The frequency of the sound you hear depends on both the volume of air in the neck of the bottle, which is pushed into the bottle like a plug, and the volume of air in
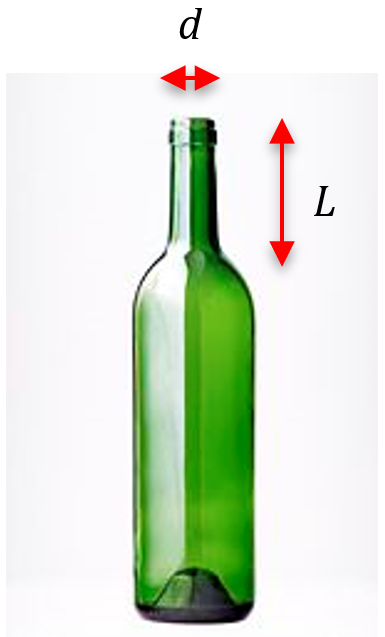
- Using the ruler, measure the diameter d of the bottle opening and the length L of the neck. Convert your measurements to meters, and record them in your report. the bottle which resonates in response. The resonant frequency heard can be written as: f=(v/2π)√(πd2/4LV), where v is the speed of sound, V is the volume of air in the bottle, d is the diameter of the bottle opening, and L is the length of the bottle neck.
- Fill the bottle to the brim with water. Now pour out some water into a measuring cup. Make sure the level of the water drops below the neck, into the cylindrical portion of the bottle. For a 750 ml bottle, you may need to pour out 100 to 150 ml. Blow across the top (a short sharp blow should do the trick) to see if you hear a tone. The volume of water you have poured out is equal to the volume V of air in the bottle. Enter the volume V you have poured out (in ml = milliliters) into column 2 of Table 2 in your report. Sample headers for Table 2 are shown below.
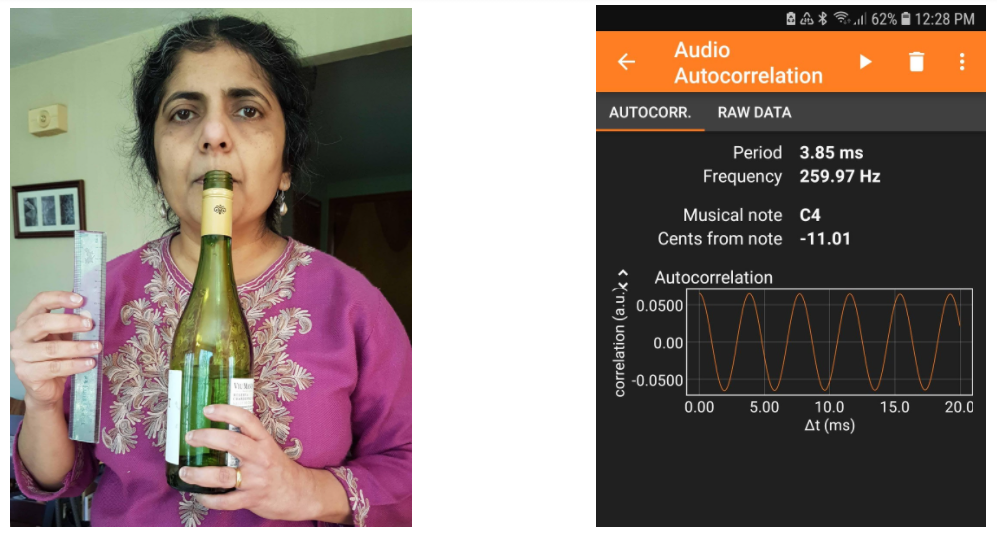
- Open the Phyphox app, and select “Audio Autocorrelation” under the “Acoustics” section. Hit play, blow across the top of the bottle, see picture on the right, and stop when you have recorded a tone. You should see what looks like a sine wave in the graph, and the note and the frequency should both be identified, see the example at the bottom of this textbox. Enter the frequency in column 3 of Table 2.
- Now pour out another 50 to 100 ml into the measuring cup, and enter the total volume that has been poured out (i.e. the volume V of air in the bottle) into column 2 of Table 2. Repeat step 3.
- Repeat steps 3 and 4 till you have at least 6 – 8 measurements. Plan the volumes you will use based on the bottle volume: the last measurement can be with the bottle completely empty, and the full volume of air the bottle can hold.
- Copy Table 2 into the online spreadsheet linked by your instructor under your group name. Enter the names of all those who have participated in this experiment on the spreadsheet.
- The data you have collected can be used to calculate the speed of sound using the next steps outlined below. This is something we will do collectively in class on Friday, but if you choose, you can do these yourself.
- Using the data in Table 2, plot frequency f vs volume V. As the formula above indicates, frequency varies as the inverse square root of the volume, so you should see a curve that decreases as volume increases.
- Convert the volume in ml to cubic meters m3 by multiplying by 10-6 (1 ml = 1 cm3), and create a new column that calculates the inverse square root of the volume.
- Plot frequency f vs this new quantity 1/√V. This graph should look like a straight line. Add a trendline fit, and record the slope of the trendline in your report
- According to the equation above, f=(v/2π)√(πd2/4LV) , the slope of the graph of frequency f vs 1/V is given by: v/2π)√(πd2/4L).
- Setting this equal to the measured slope in step 10, we get the measured speed of sound to be: v= 4π√(L/πd2) *measured slope, where we substitute your measured values of d and L. Record this value, it’s your experimentally determined value of the speed of sound v.
.
Table 2 Headers
| Run # | Volume V (ml) | Frequency (Hz) |
| 1 |
Remote Experiment 2 Exercise
Compare your experimentally determined value of the speed of sound to the value obtained independently in Part I, and the known value of the speed of sound. Discuss what factors could have influenced differences that you observe.
Further reading on Helmholtz resonators found here: https://newt.phys.unsw.edu.au/jw/Helmholtz.html