
2 Lab Activity 2
Part I: Waves on a slinky
Experiment 1: Pulses
Equipment: Slinky, Meter stick, timing device
Please be careful not to overstretch or entangle the slinky. It is easy to do and impossible to fix.
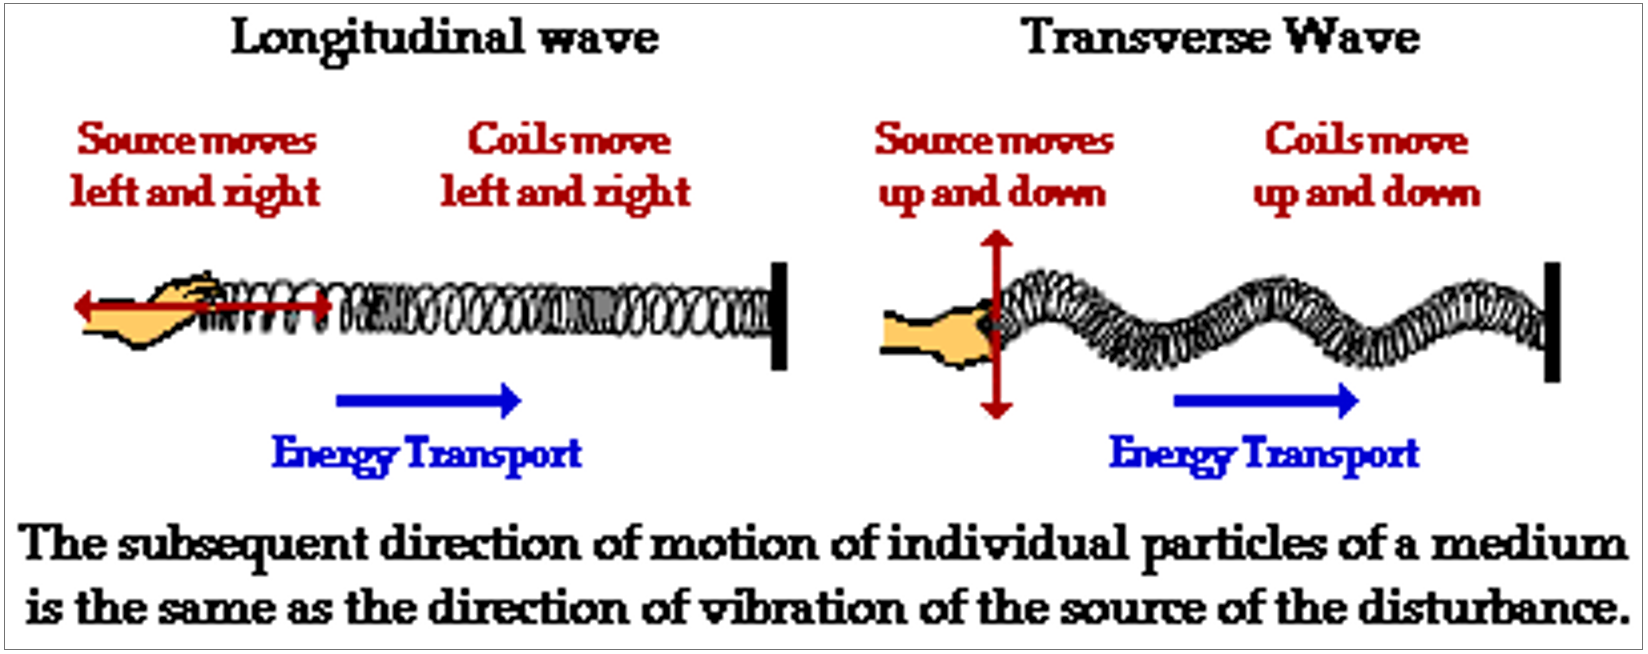
Pulses can be generated in a slinky stretched out on the table (or floor) by one person holding one end firmly and another person giving his/her end a single quick jerk sideways and back. This is called a transverse pulse. A longitudinal pulse can be generated by one person giving a single quick push-forward-pull-back motion to one end of the slinky.
Start by stretching out the slinky to a certain length, and try to keep this length fixed for all your experiments. Do not overstretch the slinky!
Enter the measured length of the stretched slinky (in meters):
Activity
Generate a transverse pulse and observe the slinky. Now generate a longitudinal pulse. Describe the motion of the wave, and the motion of a single point on the slinky, for both types of waves.
Exercise 1
How is the motion of the medium different from the motion of the wave? Make illustrative diagrams below for both the transverse and the longitudinal pulse, describing for both cases how the medium moves, and how the pulse travels along the slinky.
Experiment 2: Speed of propagation
Activity
The speed of propagation (or wave speed) is the speed at which the pulse moves. In the table below, mark the distance travelled and time taken for each of the two types of pulses (using a meter stick and a timer), and calculate the wave speed. Make sure you are doing this consistently – i.e. following the leading edge of the pulse, for example.
Now investigate what affects the wave speed. Determine the answers experimentally, e.g., do two more trials. Vary the amplitude (how far you move it from the rest position) between trials. Calculate the speed each time, enter below, and respond to the questions below.
Fill in this Table
| Transverse
|
Longitudinal
|
|||||
| Time | Distance | Speed | Time | Distance | Speed | |
| Trial 1 | ||||||
| Trial 2 | ||||||
| Trial 3 | ||||||
Exercise 2
According to your data, are the speeds for the longitudinal and the transverse wave different, or do they travel at the same speed? Did you expect this result? Explain.
Exercise 3
Does the amplitude (how far you move the end of the slinky in creating the wave) change the wave speed? Do you expect it to do so? Discuss
Part 2: Measuring the Speed of Sound: Analysis of previously recorded file.
Activity
- Install the program Audacity on your computer, or login to a lab computer which should have the program already installed.
- install link: https://www.audacityteam.org/download/
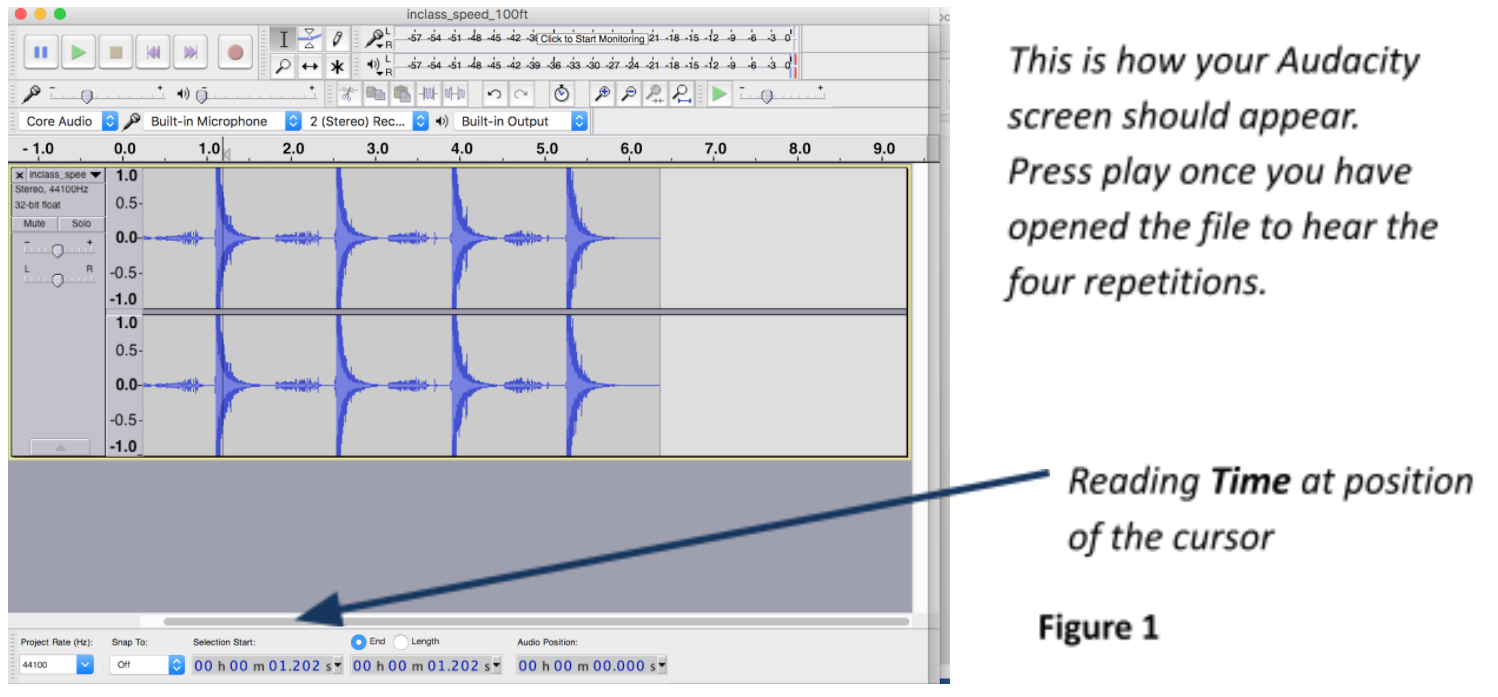
- Download the linked audio file titled “inclass_speed_100ft.wav” from the course Moodle page, and open it in Audacity. You should see 4 different realizations of the clapping sound of a clipboard. In each, you will see a waveform of amplitude that decreases with time:
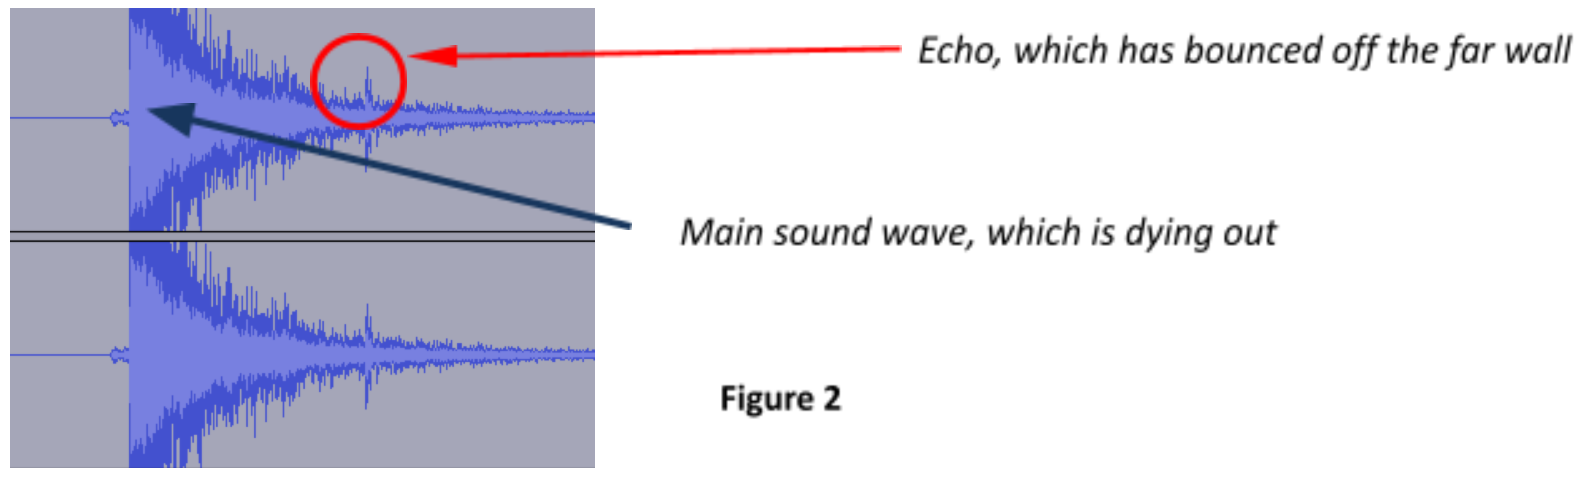
- Use your cursor to select one of the sound waveforms, and go to “View” and “Zoom to selection”. This is what you should see (I have highlighted the third sound here for clarity):
- Place your cursor at the beginning of the loud sound, click, and drag it to the position of the echo. At the bottom of your screen, where you can read the time at the position of your cursor, select “Start and Length of Selection” and below that, in the slot where the readings show, select “hh:mm:ss + milliseconds”. Read the length of the time interval off the screen. Do this for all 4 repetitions, and record each time interval reading in the table provided below.
- I was standing at a distance of 100 ft from the wall when I did this measurement. What is the total distance travelled by the sound between the time it was generated and the time when the echo was recorded? Record this in the table below – it should be the same for each trial.
- Find the speed of sound for each trial and record it in the table below.
- Find the average of the four speed trial measurements in the speed column, and record this in the last row in the column below.
Fill in this table
| Distance(ft) | Time(s) | Speed = Distance/Time (ft/s) | |
| Trial 1 | |||
| Trial 2 | |||
| Trial 3 | |||
| Trial 4 | |||
| Average |
Exercise 4
Write down the expected value of the speed of sound in feet/second: ____________
Exercise 5
How well does the average value of all four measurements in the table above agree with the expected value of the speed of sound?
Exercise 6
Part III: Measuring the Speed of Sound: Experiment
There are two ways to do this experiment, depending on whether you have access to more than one phone with the PhyPhox app loaded.
Method 1: Two phones with PhyPhox loaded. You can also look up the instructions for this experiment in this youtube video by the PhyPhox creators: https://youtu.be/uoUm34CnHdE
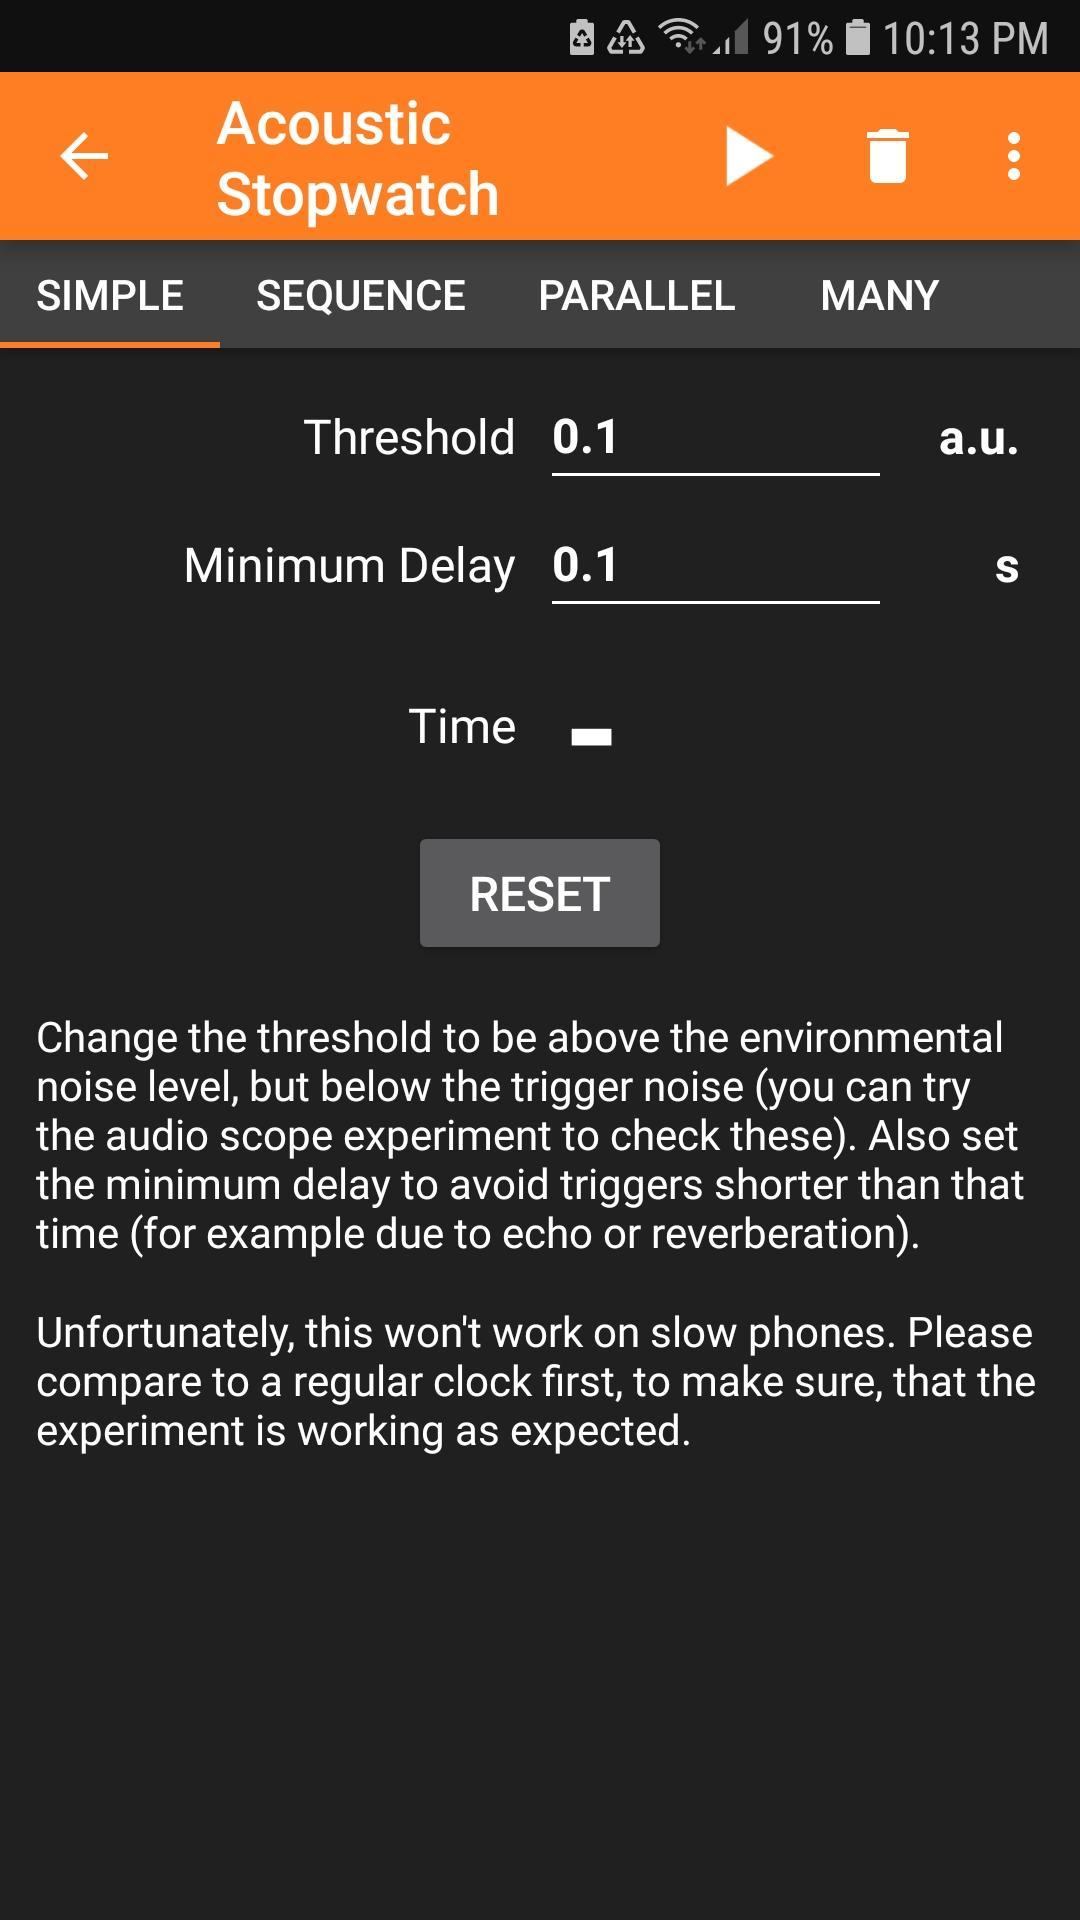
- Open the PhyPhox app on both phones, and scroll down to select the “Acoustic Stopwatch” setting under “Timers”.
- You should see the screen shown below on the left, Figure 3a (stay on Simple):
- Figure 3a:
- Figure 3b:
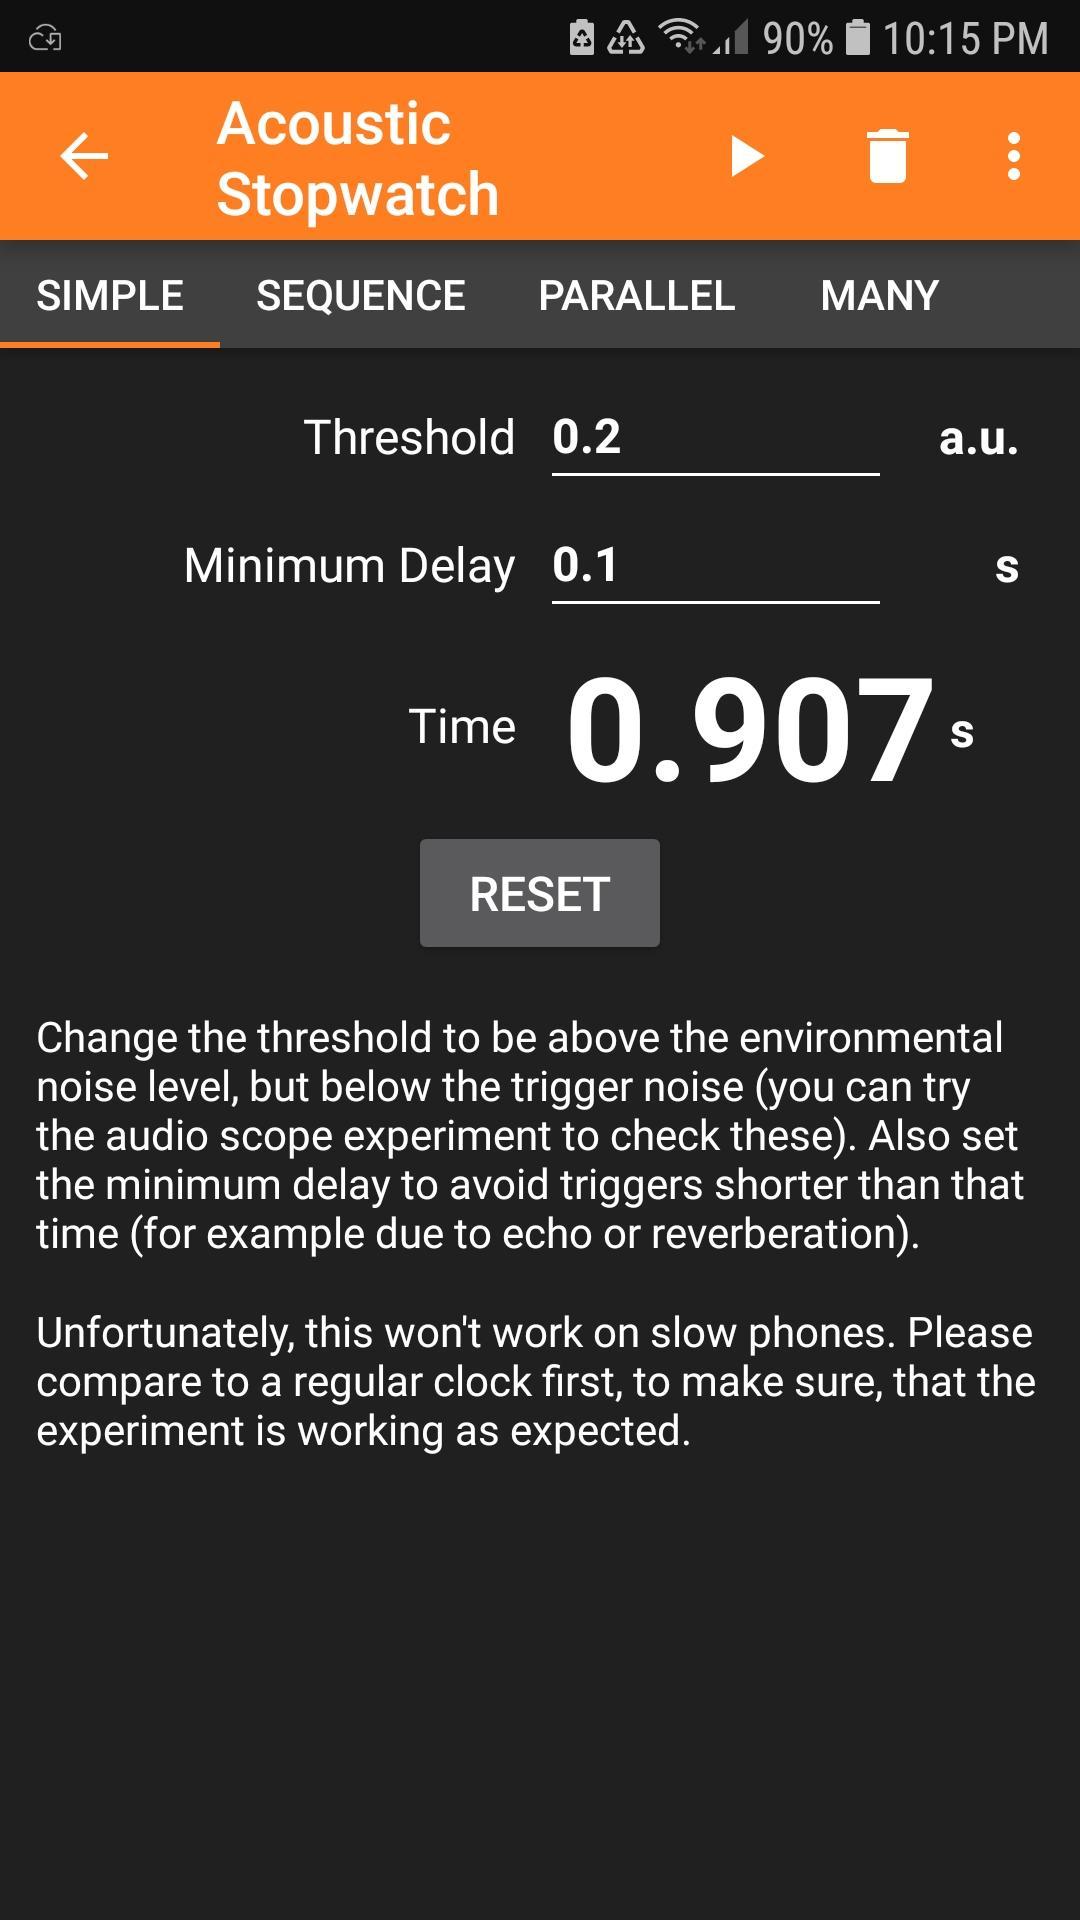
- Figure 3a:
- Click on the play button. If the timer starts and stops, your background noise level is too high. This stopwatch is triggered (started/stopped) by loud sounds. The loudness threshold can be changed so that it doesn’t get unintentionally triggered by background noise. Click on the “Threshold” entry and raise that to 0.2 or 0.3, or whatever value is needed so that it is not triggered by the background noise. Do this for both phones.
- Place the two phones in a room separated by some distance. Measure the distance d between them using any calibrated measurement device (tape or a ruler). Make sure d > 6 feet.
- Note your measured value of d here, with units: d = _____________
- This next part can be done by two people, or one person. In either case, the readings on the two phones should be different. Make sure there is no other loud sound that stops the clocks.
- If one person: Set both phones down and press the play button on both, making sure they are not triggered. Stand next to one, clap loudly, then walk over to the other, clap loudly again. The first clap will trigger both phones to start, and the second clap will stop both phones, giving you a time measurement on each phone as shown in Figure 3b above.
- If two people: The procedure is exactly the same, except one person stands next to phone 1, the other next to phone 1. Person 1 claps first, then person 2 claps.

Note the readings on the two phones:
Trial 1: Reading1 (phone 1):________seconds
Reading2 (phone 2): _________ seconds
Trial 1 Time Difference: t1 = Reading1 – Reading2 = ___________ seconds
Repeat this a second time:
Trial 2: Reading1 (phone 1):________seconds
Reading2 (phone 2): _________ seconds
Trial 2 Time Difference: t2 = Reading1 – Reading2 = ___________ seconds
The difference between these times represents the time taken by sound to travel two times the distance d that separates the two phones. Your two measurements for the speed of sound is then given for the two trials as follows: Speed v = distance/time where d: value you measured in step 5. Provide units with your answer:
Trial 1 v1 = 2d/ t1 = _______________
Trial 2 v2 = 2d/ t2 = _______________
Find the average of these two values, and enter both trial results on the online spreadsheet linked below:
Average measured speed of sound = ___________
Remember to include units with your answer!
Online spreadsheet link:
https://docs.google.com/spreadsheets/d/1LCwiRrdsa6wZLM_X4pFZ-QkeU0ykxBP8uwJYeAkPyUE/edit?usp=sharing
Include a screenshot of the measurement on your phone screen with your lab submission.
Method 2
Materials needed:
- A computer/device with a microphone, and Audacity loaded.
- A means to make a loud sharp sound. This could be a yell. You are looking for an echo.
- Access to an open area with a wall (such as the outside wall of your building)
- Make sure your computer’s microphone is turned towards the wall.
- Measure the distance from your computer to the all off of which you are recording an echo, and record this in Table 2 below.
- Use Audacity’s “Record” mode to start recording, and do 4 quick repetitions of the loud sound, then stop recording. The recorded wave should resemble the first figure in this worksheet, with a decreasing amplitude. Make sure you can identify the main sound and its echo. If not, repeat the measurement.
- Using the methods of Part 1, measure the time interval between the sound and its echo for all four repetitions, and record them in Table 2 below.
- Calculate the speed for all 4 trials, and record them in column 4 of Table 2 below.
- Calculate the average of all four speed measurements and enter this in the table below.
- Save your audacity file as a .wav file and upload it to Moodle. Label it by your team number.
Fill in this Table
| Distance(ft) | Time(s) | Speed = Distance/Time (ft/s) | |
| Trial 1 | |||
| Trial 2 | |||
| Trial 3 | |||
| Trial 4 | |||
| Average |
Exercise 7
Compare your measured average value from the table above to the expected value of the speed of sound (expressed in the same units). How does your measurement compare?
On the online spreadsheet linked below (and from our course Moodle page), use one row to enter your team number in column A. Enter the distance you used in column B and your measurement of the average speed from the table above in column C.
https://docs.google.com/spreadsheets/d/1LCwiRrdsa6wZLM_X4pFZ-QkeU0ykxBP8uwJYeAkPyUE/edit?usp=sharing