
5 Lab Activity 5
Standing wave modes on a string
Overview: Resonant Modes/Standing Waves of a string tied at both ends
A wave propagating on a string reflects when it reaches the end of the string. If this end is tied, the wave inverts upon reflection (which means the wave shifts by half a cycle). By the principle of superposition, waves that travel back and forth on the string add to give a composite wave.
If the wavelength/frequency of waves travelling on the string takes on a special set of values, the superposition of these travelling waves gives rise to a standing wave. Standing waves result when an integer number of half-wavelengths fit into the length of the string, as shown in the figure below.
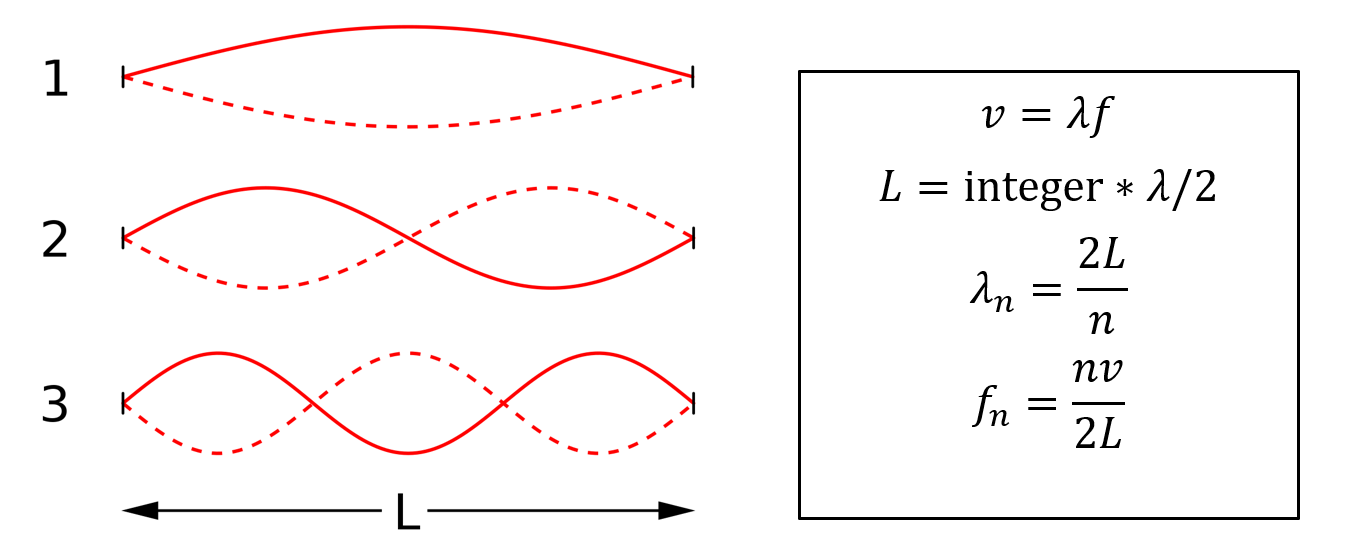
These standing waves are also called the resonant modes of the string, and only occur at special values of wavelength, when the string length L = integer * (λ/2), where λ is the wavelength of the particular wave. This in turn implies that the wavelengths of these resonant modes depend purely on the length of the string, and are given by the following relation, where the mode number n is an integer: λn = 2L/n
The basic relationship between wavelength and frequency for linear waves is v = λf, where v: speed of the waves on the string. Using this, we find that the frequency of the waves that give rise to the standing wave or resonant modes also follow a special relationship:
fn = v/λn = nv/2L
In other words, the allowed resonant mode frequencies can be written as fn = nf1 where n is called the mode or harmonic number, and f1 = v/2L is called the fundamental, or first harmonic. This fundamental frequency depends on the speed of waves on the string, and the length of the string. Higher resonant standing wave mode frequencies are integer multiples of this, generating what in music is called a harmonic series. The speed v of waves on the string is determined by the string tension T and mass density μ: v = √(T/μ)
In Person Lab
In Person Activity 1
Equipment: Pasco vibration generator, orange string + adapter to hold string, stand, Pasco 850 interface, Capstone software (on computers in classroom), ruler.
The experiment set up in class today allows you to measure the resonance frequencies of the first few harmonics of a string tied at both ends.
- Measure and record the length of the string
- Open the Capstone software with the Pasco 850 interface connected to the computer. Select “Signal Generator” on the left.
- Set the frequency to 10, the Amplitude to 5, and the Current Limit to 0.55 A. Use the On and Off buttons to activate the wave driver. Then click “On” to begin adding energy to the string.
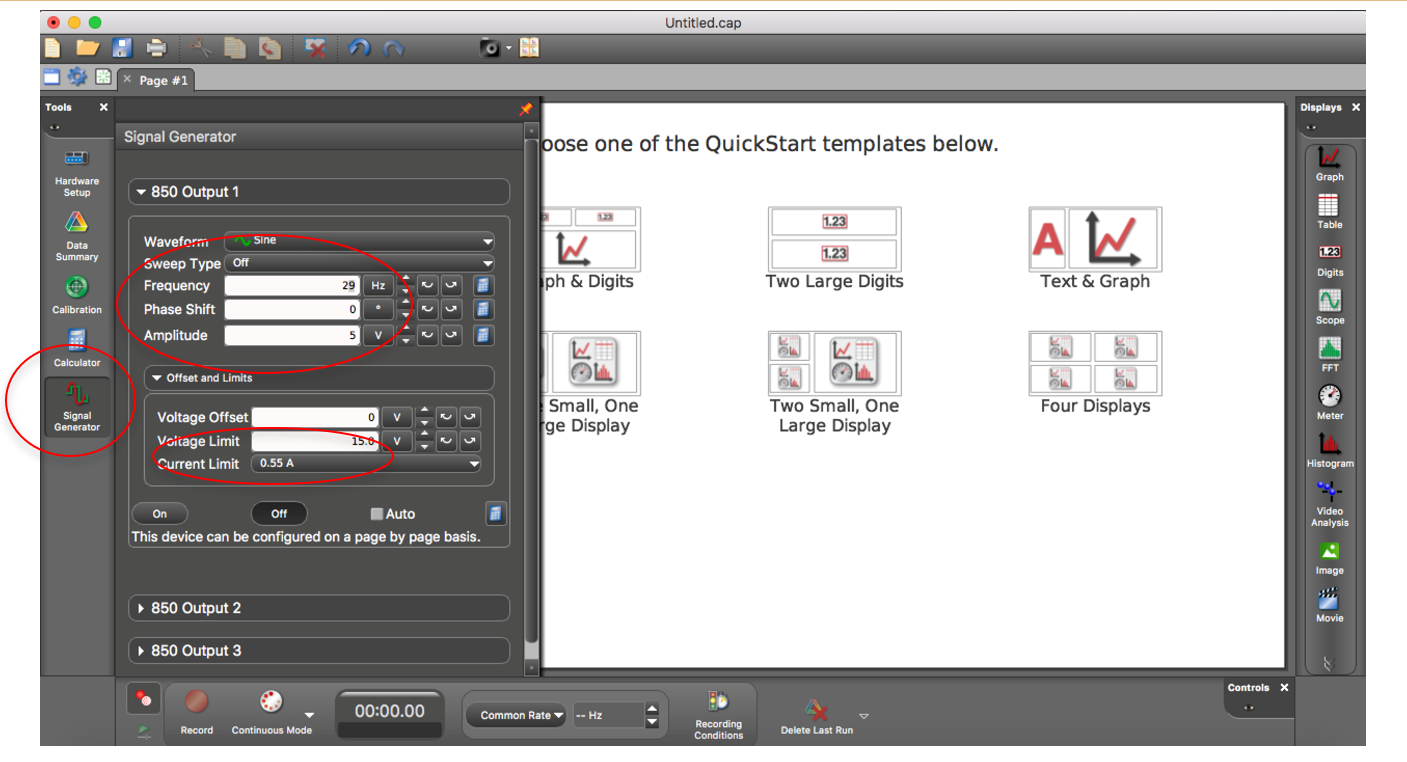
- Make adjustments to the frequency to find the first few resonant modes. You can either type in the frequency or use the up/down arrows to the right of the Frequency display to control the frequency with which the mechanical driver shakes the string. You will know you have reached a resonance when the wave appears to stop moving, and the amplitude at the antinodes increases. If you know you are close to a resonant mode, you can change the fine-tuning of the frequency using the arrows to the right of the up/down arrows – these change which digit of the frequency number is varying.
- Each time you hit a resonant mode, record the mode number and frequency in columns 1 and 2 of Table I (use the rule: mode number = # of antinodes). Use your measured length of the string (see Question 1) to figure out the wavelength for each resonant mode and record it in Column 3 of Table I.
In Person Table I Headers
| Mode Number
(n) |
Frequency(Hz) (Record) | Wavelength (m)
(Measure) |
Wave speed (m/s) (Calculate) |
Exercise 1
According to your data, how does mode frequency fn depend on mode number n? Is this behavior consistent with what is expected for the resonant modes of a string fixed at both ends? Discuss.
Exercise 2
Use the measured frequency f and wavelength λ values in columns 2, 3 of Table I to calculate the wave speed v in this string for each mode. Recall v = λf. Do you get the same wave speed for each mode? Is this what you expect? Discuss.
Exercise 3
Keeping the drive amplitude fixed at 5V, describe what you observe happens to the amplitude of the standing wave as the mode frequency increases.
In Person Activity 2
Now, alter the length of the string, record the new length, and repeat the measurements to find the first few resonant modes of the string. Enter them in Table II.
In Person Table II Headers
| Mode Number
(n) |
Frequency(Hz) (Record) | Wavelength (m)
(Measure) |
Wave speed(m/s) (Calculate) |
Exercise 4
Looking at Table II, discuss your results. Has the wave speed changed? Have the mode frequency and wavelength changed in the way you expected? Discuss.
Exercise 5
Compare the frequencies at the new length L to those at the old length L for the corresponding modes. How does the ratio of the frequencies for corresponding resonant mode numbers n compare to the ratio of the lengths Lnew/L?
Exercise 6
The instructor will do a demonstration experiment of the resonant modes of a stretched string that has a mass attached to one end. What happens to the resonant frequencies when this mass is increased? Describe what you observe.
Exercise 7
In changing the mass, what changed in the physical properties of the vibrating string that changed the resonant modes?
Remote Lab
Remote Activity 1: Video Analysis
Equipment: String driven at one end by a mechanical vertical vibration generator. The other end of the string is held under tension by a mass suspended over a pulley. The video shows the first few resonant modes of the string for three different suspended masses: 100g , 200g, 300g. Also shown is the driving frequency on the frequency generator. The voltage of the frequency generator is held fixed at 6.0 V.
Make a spreadsheet in your lab report, use the Remote Table 1 Headers below to set up your table.
Video is at the link: https://youtu.be/0RbVeCQLSZo
- The measured length of the string is L = 137.5 cm.
- The first set of data is for a suspended mass of 100 g = 0.1 kg. The tension in the string is the weight of this mass in N. Recall Weight = mg. Record this in column 1 of your table.
- For the first set of standing wave modes in the video, record the mode number and observed frequency in columns 2 and 3, each time we hit a resonance. Use this rule: mode number = # of antinodes. You will know you have reached a resonance when the wave appears to stop moving, and the amplitude at the antinodes increases. Use your measured length of the string (see Step 1) to figure out the wavelength for each resonant mode and record it in Column 4.
- Now record the frequencies associated with the next set of resonant modes for the 200g weight in columns 2 and 3. Use your measured length of the string (see Step 1) to figure out the wavelength for each resonant mode and record it in Column 4. Record the associated tension in column 1.
- Finally, repeat the procedure in steps 2 and 3 for the last suspended 300 g weight.
Remote Table 1 Headers
| Tension (N)
(calculate) |
Mode # | Frequency (Hz)
(read off video) |
Wavelength (cm)
(infer) |
Wave Speed (cm/s)
(calculate) |
Exercise 1
According to your data, how do the mode frequencies fn depend on mode number n? Is this behavior consistent with what is expected for the resonant modes of a string fixed at both ends? Discuss.
Exercise 2
Describe what you observe happens to the amplitude of the standing wave as the mode frequency increases.
Use the measured frequency f and wavelength λ values in columns 3 and 4 of Table I to calculate the wave speed v in this string for each mode, and record this in column 5 of the table. Recall v = λf. Do you get the same wave speed for each mode? Is this what you expect? Discuss.
Find the average speed of waves on the string by finding the average of the values in column 5 for a given tension. Do this for all three tension values. Convert this wave speed to units of meters/second. (Bonus: find the standard deviation in each set of values.)
Exercise 5
Given the tension in the string from column 1, and the average wave speed calculated in question 4, calculate the linear mass density of the string (m/L). Is this the same for your three different values of tension? Discuss.
Experiment: Standing Wave analysis using an online tool
An available online tool allows you to do a similar analysis of what factors influence the frequencies on the resonant modes of a string. Find it here: https://ophysics.com/w8.html
The standing waves on the online applet are generated by vibrating one end (on the right hand side, where the tuning fork is placed). As you saw in the video in part 1, a driven string under tension and fixed at both ends, will have waves traveling back and forth in no discernable pattern for most most choices of driving frequency. For the right choice of frequency, a standing wave pattern appears – this is not a wave that is stationary, but one in which certain points, called nodes, do not move at all. This occurs when the string is driven at a natural frequency (or harmonic) of the string, satisfying conditions of resonance.
When you load the applet, it will show you a resonance condition for specific values of frequency, tension and linear density.
Make a spreadsheet in your lab report, use the Remote Table 2 Headers below to set up your table.
- Gently move the frequency slider back and forth and get a feel for how well you can pin down the resonance. Enter the tension, linear mass density and frequency in row 1 of Table 2.
- Count the number of wavelengths you observe, determine which mode this is, and use the length of the string to determine the wavelength of this mode. Enter this in Table 2.
- Calculate the speed of the wave using the wavelength and frequency, v = λf and enter it in row 1 of Table 2.
- Calculate the expected value of the wave speed using the values of the linear mass density μ and the tension: v=√(T/μ). Compare with the value calculated in step 3.
- Attach a screenshot of the resonance condition with your lab report.
- Change the tension, and find another mode. Enter the corresponding values in row 2 of Table 2. Attach a screenshot of the resonance condition.
- Finally, change the linear mass density m, and find a resonant mode. Fill in row 3 of Table 2. Attach a screenshot of the resonance condition.
Remote Table 2 Headers:
| T (N) | μ (kg/m) | f (Hz) | λ (cm) | v = λf (m/s) | v=√(T/μ) (m/s) |
Exercise 6
How well do the values of the wave speed in column 4 of Table 2 agree with those in column 5? How do the values in the different rows compare? Discuss.