3 RC Circuits
Setup Video:
Record all predictions, observations, and responses in the lab report document.
In this lab we will create a circuit with a resistor and a capacitor, which we call an RC Circuit. A capacitor is an electronic component that is capable of storing electric charge. We will “charge up” the capacitor using energy from the IOLab device’s batteries and then “discharge” the capacitor to release the stored energy. We will start off by (1) charging a capacitor so we can see it discharge through an LED. Then we will (2) determine the true capacitance of the capacitor by discharging it through a resistor and using the Analog 7 sensor to monitor the change in voltage as the capacitor is discharged. This will provide us with some data to work graphically with to determine the true capacitance. Finally, we can (3) use the true capacitance and the Analog 7 sensor data to determine the amount of charge that the capacitor holds.
Part 1: Briefly lighting an LED
In this part we will see how we can use a capacitor to light up an LED momentarily.
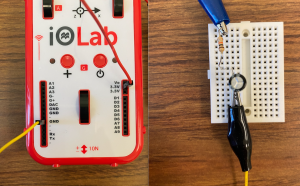
- We can start by setting up the circuit in Figure 1 that consists of a 10kΩ resistor in series with a 56 𝜇F capacitor. (The MPN for this capacitor starts with RK1E560M. Also, the capacitor itself is labeled with 56 𝜇F.) (Digikey: Part Desc: CAP ALUM 56UF) When we used resistors in the previous labs, it didn’t matter how they were oriented. These capacitors, however, need to be oriented a certain way. When you examine your capacitor, you will notice that it has a longer lead and a shorter lead. The longer lead is positive and the shorter lead is negative. So when you place these in a circuit, the positive end needs to be connected toward the positive side of your power source, the 3.3 V port. The negative end needs to be connected toward the GND port.
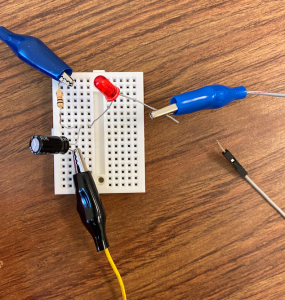
- When you turn on the IOLab device, the capacitor will begin charging. After a few seconds the capacitor will be fully charged. We can see it discharge through the red LED. To do so, we can take the blue alligator clip off the positive side of the 10 kΩ resistor so that the capacitor is no longer getting any power. Then we can place the LED in the circuit as in Figure 2. You will notice that the LED also has a longer lead and a shorter lead. LEDs also have a positive and negative end. Connect the positive lead of the LED to the positive lead of the capacitor. The blue alligator clip with gray wire is connected to the negative end of the LED and the pin end of the wire will be use to touch the negative end of the capacitor. (Digikey: You can plug the negative end of the LED into an unused breadboard row and connect it with a regular pin to pin jumper wire.) When you do this you should see the LED light up very briefly. Once you get the LED to light up briefly, you know that your circuit is hooked up correctly.
Part 2: Finding the true capacitance of the 56 𝜇F capacitor
Recall from the Ohm’s Law lab that the resistors you are using do not have the exact amount of resistance as advertised. This is also true of the capacitor’s “capacitance”. Capacitance tells us how much charge the capacitor is capable of storing. In this part we will determine the true capacitance of the 56 𝜇F capacitor.
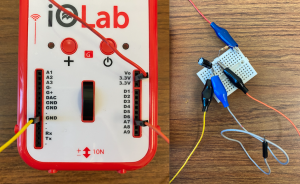
- We will start by using the same setup as Figure 1. Then we will connect the positive end of the capacitor to the A7 sensor (my black alligator clip with orange wire) and connect another wire to the negative end of the capacitor (my blue alligator clip with gray wire). The pin of the gray wire will be used to discharge the capacitor through the resistor. See Figure 3.
- In the IOLab software choose the Analog 7 sensor. With this setup we can measure the voltage as it changes during the capacitor’s discharging. When you start recording with the Analog 7 sensor you should see that it is reading 3.3 V. Unplug the wire from the 3.3V port and then touch the pin of the gray wire to the lead of the resistor that was connected to the 3.3 V port. If you hold the wire to the resistor for a few seconds you will see the voltage decrease as the capacitor discharges through it. Then while you are still recording, reconnect the 3.3 V port to the circuit. Now you will see how the capacitor charges gradually up to 3.3 V. What can you say about the way the capacitor charges and discharges?
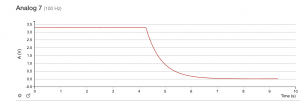
- Now let’s collect some data that we can use to help us determine the true capacitance of the capacitor. (Steps 3 – 8 may be easier to follow in the setup video.) Charge your capacitor fully up to 3.3 V. Once you have done this, I recommend that you click “Reset” once in the software to start off with a fresh graph. Then click “Record” and discharge the capacitor fully. Then click Stop. You should have a graph similar to Figure 4. Record the initial voltage
 that the capacitor had before discharging.
- Just below the y-axis on the graph is a “Tool bar” button. See Figure 5.
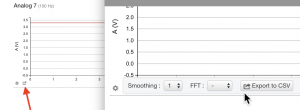
- Click on this and you will find a button called “Export to CSV”. This will save the data to a file on your computer. In your “Documents” folder you will find a file called “IOLab-WorkFiles”. (This folder was placed here when you installed the software.) Within this folder is a subfolder called “export”. This is where you will find the saved .csv file. You can open this file and work with the data using any spreadsheet software. The instructions here will use Microsoft Excel since any student taking a course at UMass has free access to this software. (If you don’t currently have it installed and want to install it you can find the instructions here: https://www.umass.edu/it/software/microsoft-office-365-education)
- The only columns we will be working with are columns D and F which are labeled “time” and “cal[0]” so you can delete the other columns. The “cal[0]” column contains the voltage measurements.
- The data we want to analyze is the portion where the capacitor is being discharged so you should delete the data before and after that interval. You can use the cursor in the IOLab software to find the time when the capacitor started discharging. Then delete all the data from before that time. Then I recommend deleting the data after the capacitor has been discharged to 0.1 V.
- Once you have the data to analyze, we can use the Plotly Chart Studio at https://chart-studio.plotly.com/create/#/ . We will use this free website to plot voltage versus time.
-
- Copy and paste your data into this spreadsheet.
- Then to the left of this spreadsheet you will see a button called “+ Trace”. When you click this button it is automatically setup to create a scatter plot.
- For the x-axis, choose the column containing the time data. For the y-axis, choose the column containing the voltage data.
- You should see a graph of the capacitor discharge like the one in the IOLab software.
- From the tool column on the left of the webpage choose the “Analyze” dropdown menu.
- From that choose “Curve Fitting”.
- Then click the “+ Fit” button.
- From the “Select A Trace” dropdown menu that appears, choose “trace 0”.
- Now we can choose the proper curve fit. From the “Family Function” dropdown menu that just appeared, choose the appropriate function to model the discharge pattern of the capacitor.
- Below the Family Function dropdown menu are the “Parameter Estimates”. Click the “Run” button to reveal these parameters.
- The A, B, and C parameters correspond to the base form of the exponential function:
 where “y” corresponds to the voltage at time “x”. “B” corresponds to the initial voltage and “C” corresponds to the resistance and capacitance of the circuit. So in physics we write this equation as
  , where “
 ” corresponds to the voltage at time “t” and “
 ” corresponds to the resistance and capacitance of the circuit. The parameter “A” corresponds to the IOLab device’s offset voltage. Record this offset voltage in your lab report. How does it compare to the offset voltage you measured in the Ohm’s Law lab?
 - The quantity “
 ” is called the “time constant”. This is simply equal to the resistance times the capacitance:
  . The “C” parameter displayed in the “Parameter Estimates” is then equal to
  or
or  .
. - Use the “C” parameter and the true resistance of the resistor to calculate the true capacitance of the 56 𝜇F capacitor. Record this true capacitance in your lab report. There is also a way we can analyze the collected data linearly. To do so, we need to get rid of the exponential function in the equation. We can start with
 and then divide both sides by
  :
:
![]()
Then we get rid of e:
![]()
This gives us:
![]()
![]() is the same as
is the same as ![]() so:
so:
![]()
Then we can divide both sides by t:
![]()
- The left side of this equation is the slope of the graph of the natural log of the voltage versus time. To plot this we first need to calculate the natural log of the voltage of all the data points. This is a simple math function in Excel. See the setup video or any other youtube video to see how to quickly get these calculations if you haven’t done this before.
-
- Copy this column of data into the Plotly Chart Studio spreadsheet.
- Then you can add a new trace and fit like we did in step 8 of this part of the lab. The only difference is that the “Family Function” will be the linear one instead of the exponential one.
- Of course the generic equation of a line is
 and Parameter “M” will correspond to the slope of the line. This corresponds to the left side of the equation we derived in step 11. Use the “M” parameter and the true resistance of the resistor to determine the true capacitance of the capacitor. Record this in your lab report.
Part 3: How much charge does the capacitor hold?
- Now that we know the true capacitance, we can determine how much charge gets stored in the capacitor. Remember that capacitance is a measure of how much charge a capacitor can hold. Mathematically, capacitance is simply charge divided by voltage or
 . So the initial charge that the capacitor has before it begins discharging is the initial voltage it has times its capacitance:
  . (You recorded the initial voltage in question 2 in your lab report.)
 - We can also determine this initial charge from the area under the curve of the voltage versus time graph we made using the Analog 7 sensor. Current is the rate at which charge flows:
 . The initial charge is then:
![]()
According to Ohm’s law V=IR so:
![]()
The resistance is constant so:
![]()
- The integral
 is the area under the curve of the voltage versus time graph we made using the Analog 7 sensor. Click and drag over the area during which the capacitor was discharging. When you do this the software reveals some calculated information in red. The data labeled “a” is a calculation of this area under the curve. Use this and the true resistance of the resistor to determine the initial charge on the capacitor. How does it compare to your first calculation? Record this in you lab report.
