
2 Acceleration due to Gravity
Part 1: Measure your height
- In this part, you will use a stopwatch and a pencil to measure your height. To do this, simply hold the pencil by the top of your head and allow it to fall to the floor. The difficult part will be pressing start and stop on the stopwatch at exactly the moment you release the pencil and the moment it strikes the floor since the time interval of the fall is less than 1 second. Your “reaction time” will create some error in your measurements. We will call the time interval during which the pencil falls T1.
- Since the pencil is undergoing constant acceleration, you can use the constant acceleration model you learned in Lessons 7 and 8 to determine the distance that the pencil fell. Calculate this distance. The result should be close to your actual height.
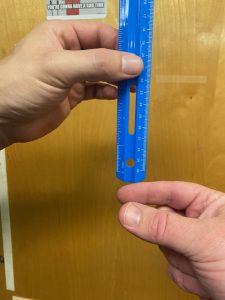
- Now you will measure your reaction time. For this you will need a ruler. This also works best if you can find someone to help you with this part. Have your helper hold the ruler just above your hand as shown in Figure 1. Tell your helper to release the ruler as you prepare to catch it. To get the most accurate reaction time measurement, it is important that you don’t know exactly the moment when your helper releases the ruler. If you do this on your own, you will know the moment when you release it and you will be prepared to catch it sooner. This will give you a less accurate reaction time measurement.
- Use the distance that the ruler fell to determine your reaction time. Like you did in step 2, you can use the constant acceleration model to use the distance the ruler fell to determine your reaction time. We will call this time interval TR.
- Now subtract your reaction time TR from the time you measured with the stopwatch T1. Then calculate your height again using this new time. You should now get a height that is closer to your actual height.
Part 2: Acceleration on an inclined plane
- For this part we are going to push the IOLab device up an inclined plane and allow it to roll back down to where it started. View the following video to watch this experiment:
- You can access this data through the IOLab repository. This data set is called “Inclined Plane”. Use the zoom tool to get a good view of the position-time graph and the velocity-time graph. Take a screen shot of these graphs. Identify the location on both graphs where the IOLab device reached its highest point/turning point. Identify the location on both graphs where the IOLab device returned to where it started at the bottom of the inclined plane. Identify the portion of the graphs where I was pushing on the device.
- After I stopped pushing on the device, it started moving with a constant acceleration. This acceleration was due to gravity. Determine the acceleration of the device from the velocity-time graph. If you use the data tool, you can click and drag over the region of interest and the symbol “s” will tell you the slope of the line.
- The acceleration should be less than the acceleration due to gravity since the device was not in free fall. We sort of diluted gravity by letting the device fall down the inclined plane. To determine the actual acceleration due to gravity, you would need to know the angle of the incline. We could use a protractor to get a good estimate of this angle but we can also calculate what the angle is because we know that gravity is 9.8 m/s2. Calculate the angle of this inclined plane. Recall from Lesson 10 the relationship
 for an inclined plane.
 - Using the data tool and the position-time graph, determine the length of the inclined plane. Describe how you were able to determine the length from this graph.
- Using the data tool and the velocity-time graph, determine the length of the inclined plane. You can refer to Lesson 8 where you learned how to determine displacement from a velocity-time graph. Describe how you were able to determine the length from this graph.
